TSLA Trading Predictions
1 Day Prediction
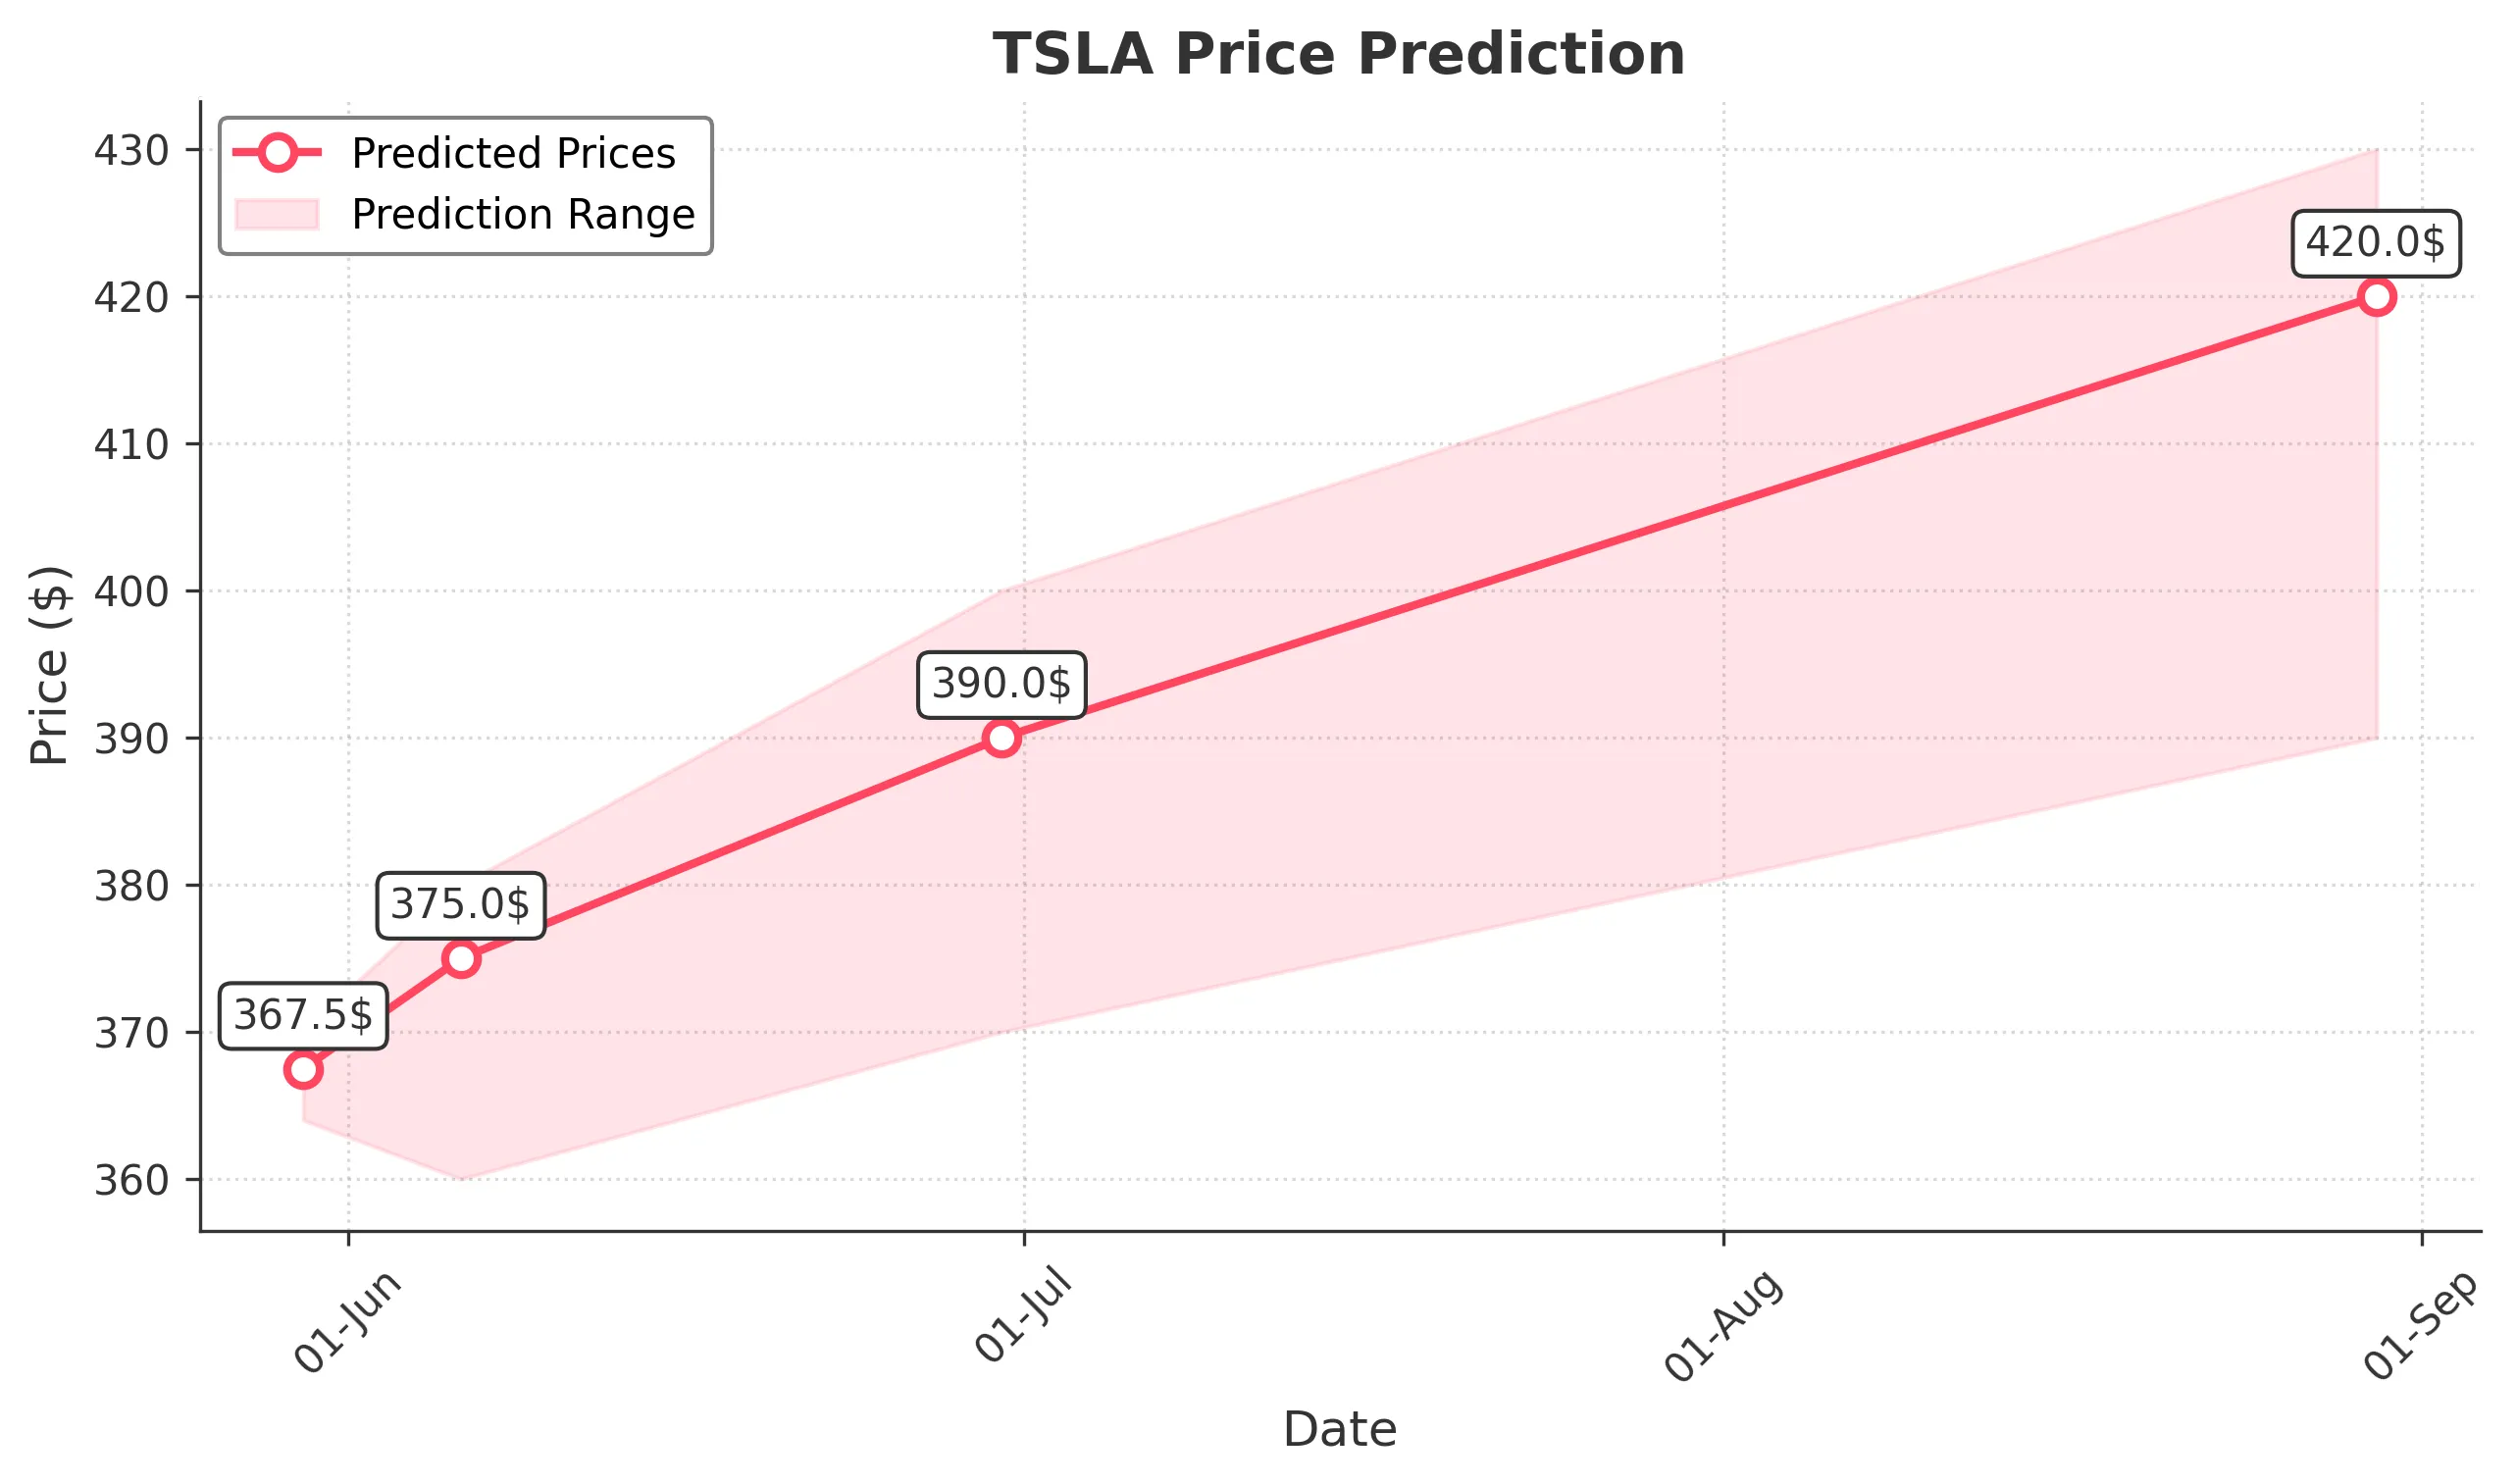
Target: May 30, 2025$367.5
$365.5
$370
$364
Description
The bullish momentum from recent highs suggests a continuation. The RSI is approaching overbought levels, indicating potential for a pullback. However, strong volume and positive market sentiment support upward movement.
Analysis
TSLA has shown a bullish trend over the past 3 months, with significant support at $340 and resistance around $370. The recent price action indicates strong buying interest, but caution is warranted due to high RSI levels.
Confidence Level
Potential Risks
Potential for a short-term pullback due to overbought RSI conditions.
1 Week Prediction
Target: June 6, 2025$375
$370
$380
$360
Description
The upward trend is supported by bullish candlestick patterns and strong volume. However, the MACD shows signs of divergence, which could indicate a potential reversal. Market sentiment remains positive.
Analysis
The stock has been in a bullish phase, with key support at $350. The MACD is bullish, but divergence suggests caution. Volume spikes indicate strong interest, but overbought conditions may lead to volatility.
Confidence Level
Potential Risks
Possible market corrections or profit-taking could impact the price.
1 Month Prediction
Target: June 30, 2025$390
$375
$400
$370
Description
Continued bullish momentum is expected, driven by strong fundamentals and market sentiment. Fibonacci retracement levels suggest potential resistance at $400, but the overall trend remains positive.
Analysis
TSLA has shown resilience with a bullish trend. Key support at $360 and resistance at $400. The RSI is high, indicating potential for a pullback, but overall sentiment remains strong.
Confidence Level
Potential Risks
External market factors or economic data releases could impact performance.
3 Months Prediction
Target: August 30, 2025$420
$400
$430
$390
Description
Long-term bullish outlook supported by strong fundamentals and market trends. However, potential economic headwinds could create volatility. Watch for key resistance at $430.
Analysis
The stock has been on a bullish trajectory, with significant support at $380. The market sentiment is positive, but external factors could introduce volatility. The potential for a correction exists if economic conditions change.
Confidence Level
Potential Risks
Macroeconomic factors and market corrections could lead to unexpected price movements.