TSLA Trading Predictions
1 Day Prediction
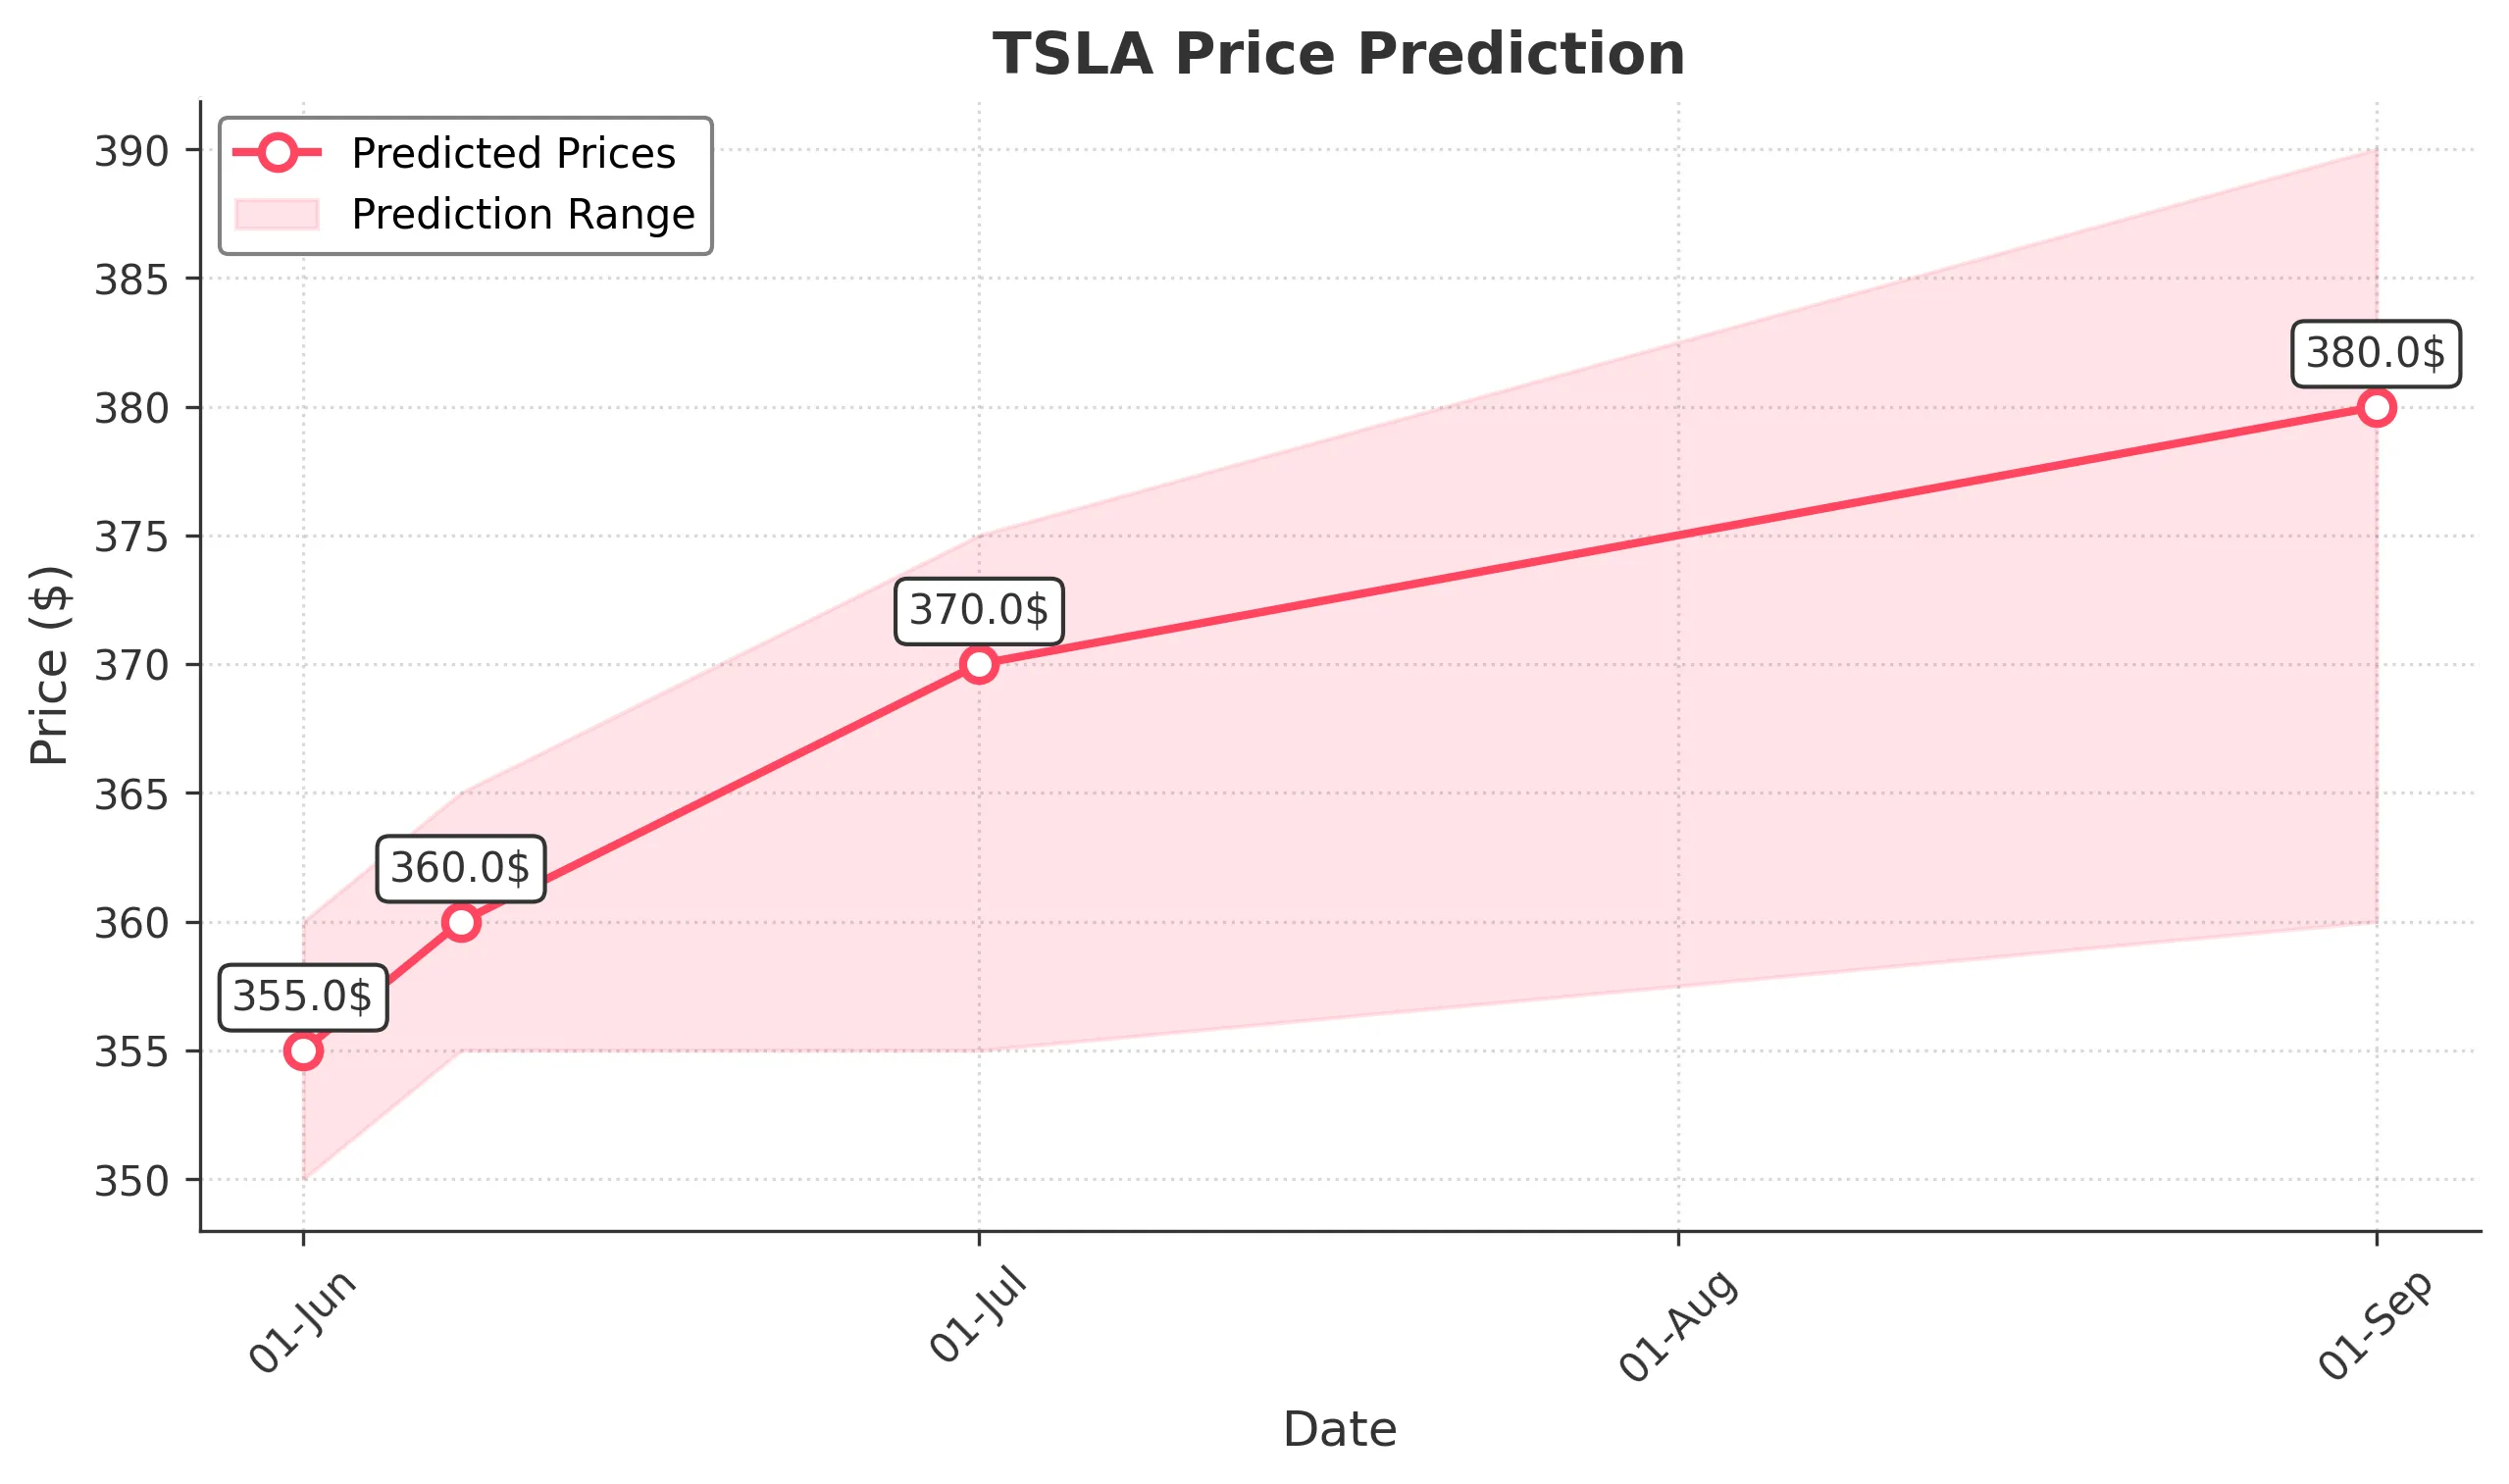
Target: June 1, 2025$355
$354
$360
$350
Description
The stock shows a bullish trend with a recent upward movement. The RSI is approaching overbought levels, indicating potential for a pullback. However, strong buying volume suggests continued interest. Expect a close around 355.
Analysis
Over the past 3 months, TSLA has shown a bullish trend with significant upward movements. Key support at 340 and resistance at 360. Volume spikes indicate strong buying interest. However, recent candlestick patterns suggest caution as the stock approaches overbought conditions.
Confidence Level
Potential Risks
Potential for a pullback due to overbought RSI and market volatility.
1 Week Prediction
Target: June 8, 2025$360
$358
$365
$355
Description
The bullish momentum is expected to continue, with the stock likely to test resistance at 365. The MACD shows a positive divergence, supporting upward movement. However, watch for potential profit-taking.
Analysis
TSLA has maintained a bullish trend, with key support at 340 and resistance at 365. The MACD and moving averages indicate upward momentum, but the RSI suggests caution as it nears overbought territory. Volume remains strong, indicating continued interest.
Confidence Level
Potential Risks
Market sentiment could shift quickly, leading to profit-taking and volatility.
1 Month Prediction
Target: July 1, 2025$370
$365
$375
$355
Description
Expect continued bullish momentum as TSLA approaches key resistance levels. The Fibonacci retracement levels suggest potential for further gains, but watch for signs of exhaustion in buying pressure.
Analysis
The stock has shown strong upward movement, with significant support at 340 and resistance at 375. Technical indicators suggest bullish momentum, but the market remains sensitive to external factors. Volume patterns indicate strong interest, but caution is warranted.
Confidence Level
Potential Risks
Market corrections and external economic factors could impact performance.
3 Months Prediction
Target: September 1, 2025$380
$375
$390
$360
Description
Long-term bullish outlook as TSLA continues to gain traction. However, potential market corrections and economic factors could lead to volatility. Watch for key support at 360.
Analysis
TSLA has shown a strong bullish trend over the past 3 months, with key support at 360 and resistance at 390. Technical indicators suggest continued upward momentum, but external economic factors and market sentiment could introduce volatility. Caution is advised.
Confidence Level
Potential Risks
Unforeseen macroeconomic events could lead to significant price fluctuations.