TSLA Trading Predictions
1 Day Prediction
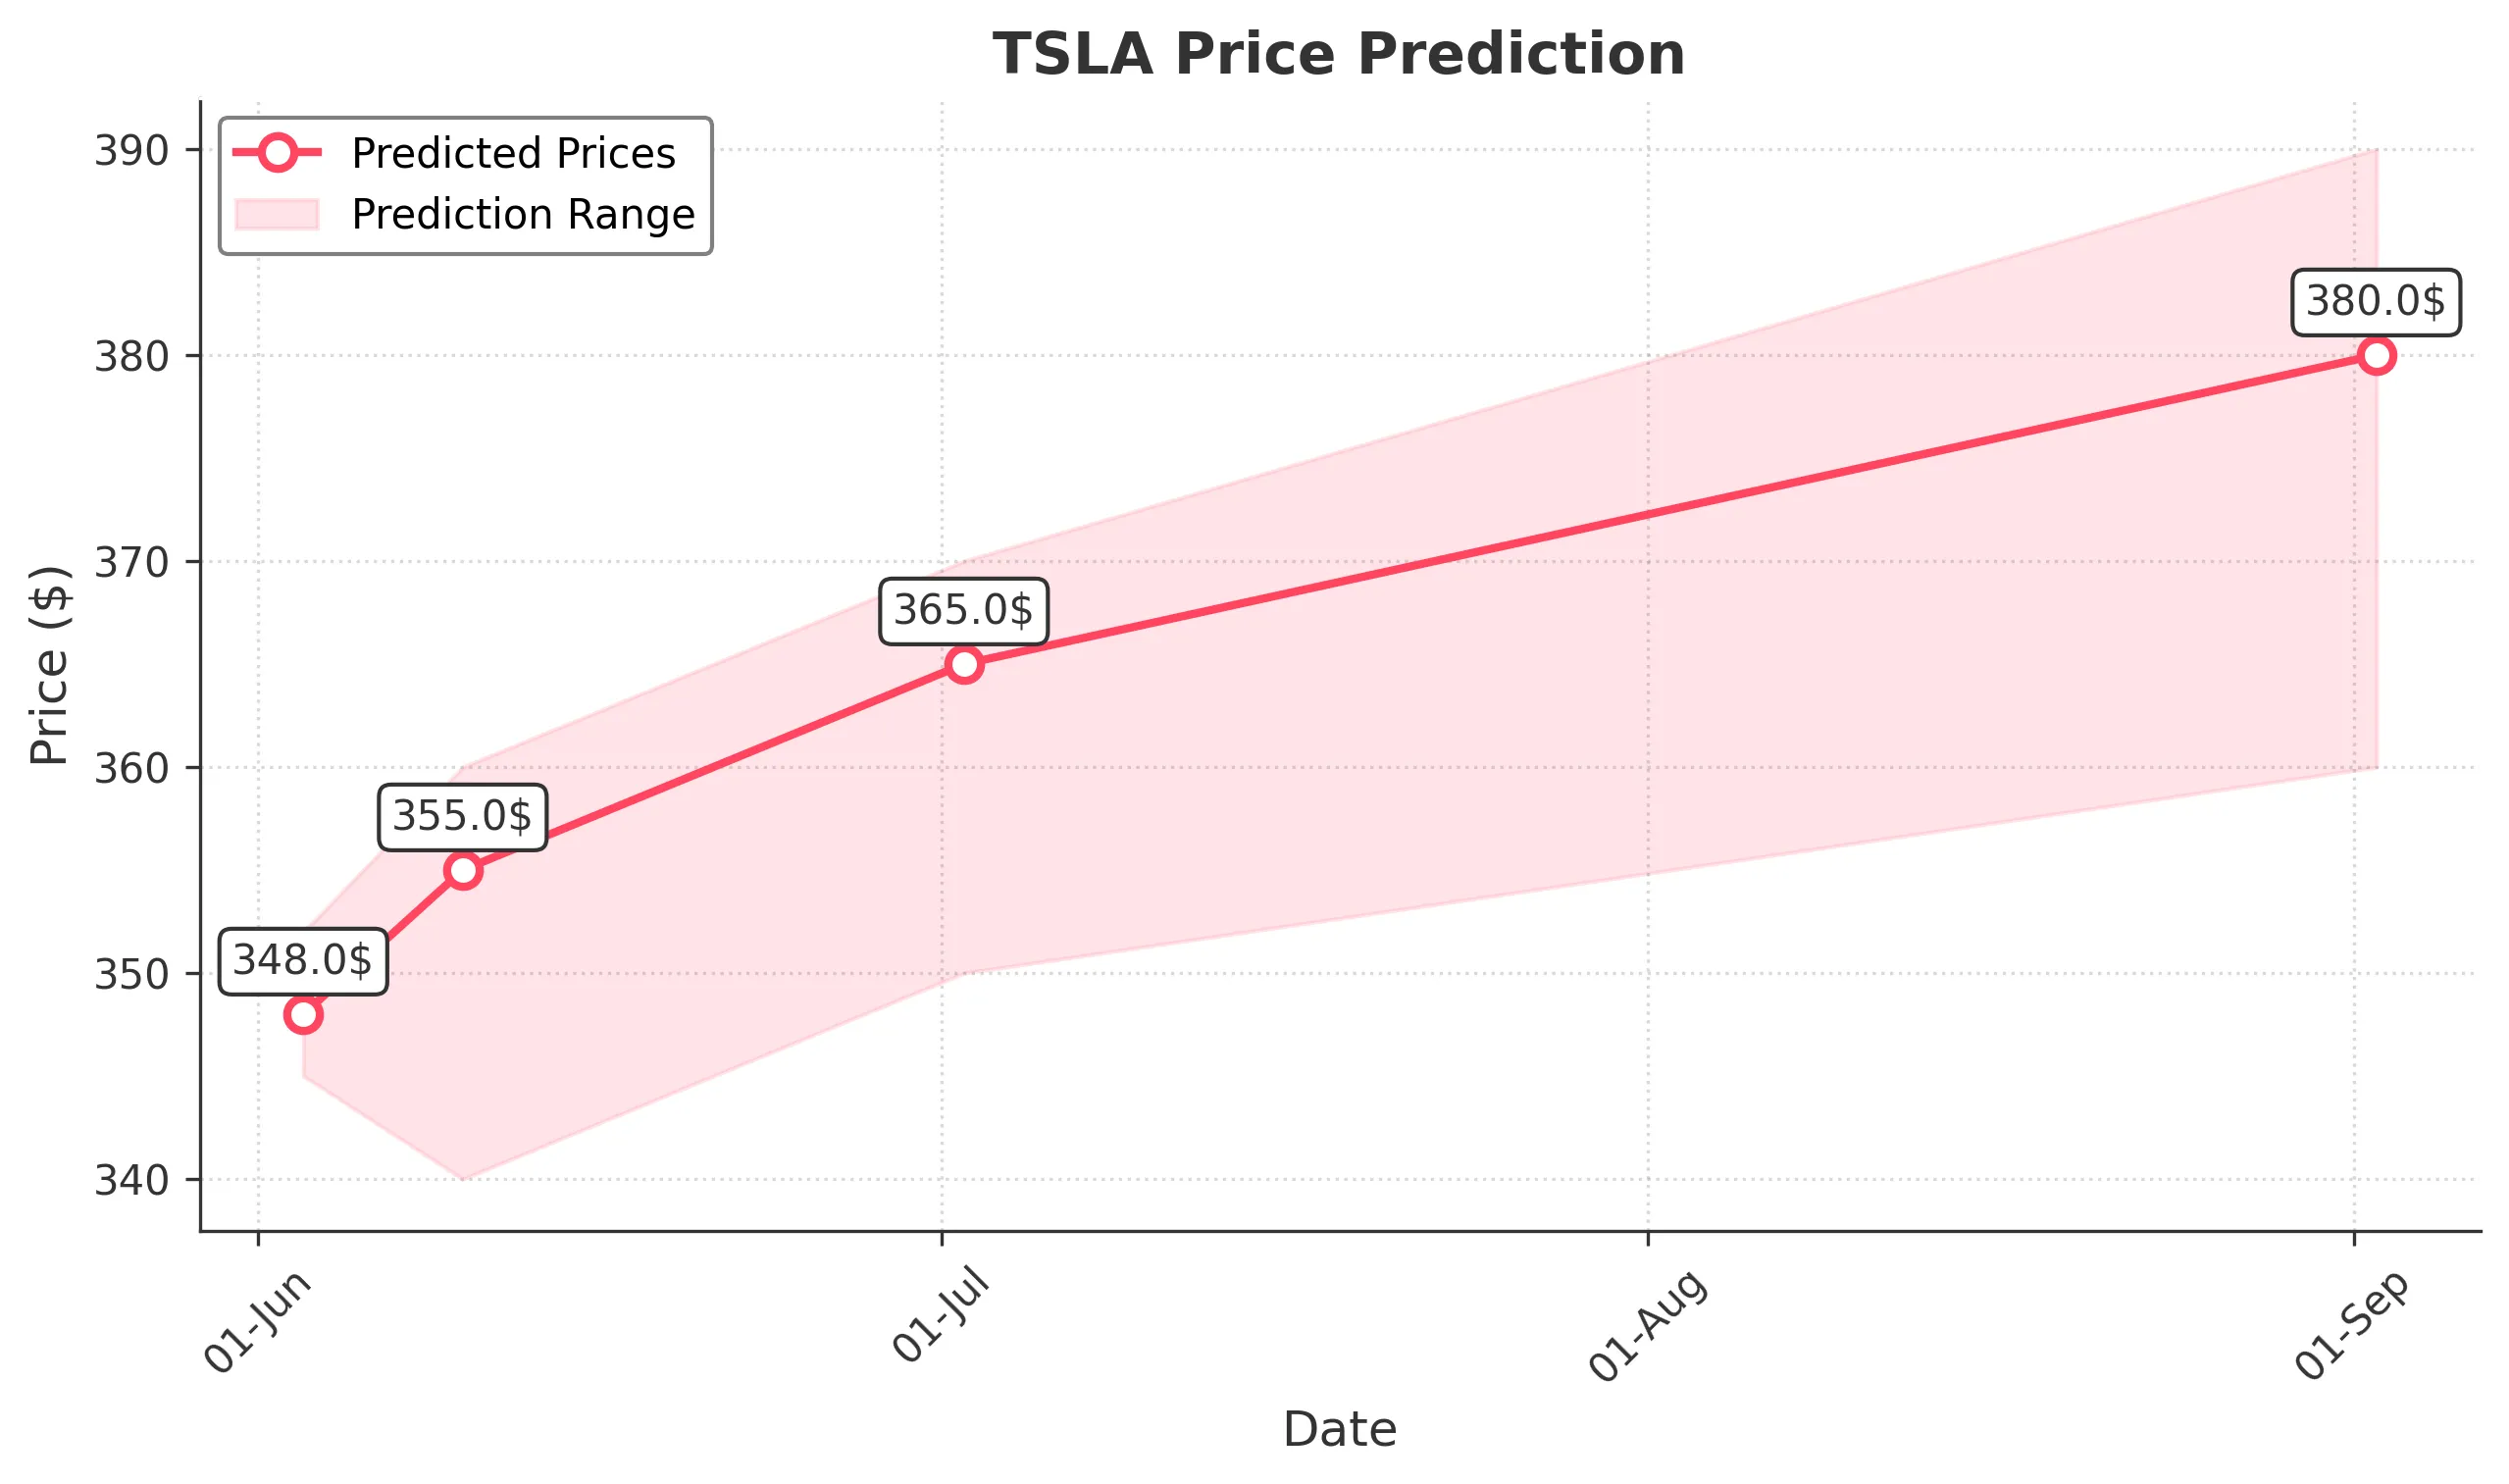
Target: June 3, 2025$348
$347.5
$352
$345
Description
The stock shows bullish momentum with a recent upward trend. The RSI is approaching overbought levels, indicating potential for a pullback. However, strong buying volume suggests continued interest. Expect a close around 348.
Analysis
TSLA has shown a bullish trend over the past three months, with significant support at 340 and resistance around 360. The recent price action indicates strong buying interest, but the RSI nearing overbought levels suggests caution.
Confidence Level
Potential Risks
Potential market volatility and profit-taking could impact the price.
1 Week Prediction
Target: June 10, 2025$355
$350
$360
$340
Description
The upward trend is expected to continue, supported by strong volume and bullish candlestick patterns. However, the market may face resistance at 360, which could limit gains. Anticipate a close around 355.
Analysis
The stock has been in a bullish phase, with key support at 340 and resistance at 360. The MACD shows bullish momentum, but the ATR indicates increasing volatility, suggesting potential price swings.
Confidence Level
Potential Risks
Market sentiment could shift due to macroeconomic factors or earnings reports.
1 Month Prediction
Target: July 2, 2025$365
$360
$370
$350
Description
Continued bullish sentiment is expected, with the stock likely to test the 370 resistance level. The Fibonacci retracement levels support this upward movement, but caution is advised as the RSI may indicate overbought conditions.
Analysis
TSLA has maintained a bullish trend, with significant support at 350 and resistance at 370. The volume has been strong, indicating investor confidence, but the potential for a pullback exists if the market sentiment shifts.
Confidence Level
Potential Risks
External market conditions and earnings reports could lead to volatility.
3 Months Prediction
Target: September 2, 2025$380
$375
$390
$360
Description
If the bullish trend continues, TSLA could reach 380, driven by strong demand and positive market sentiment. However, potential resistance at 390 may limit further gains. Watch for any macroeconomic changes.
Analysis
Over the past three months, TSLA has shown a strong upward trend, with key support at 360 and resistance at 390. The stock's performance is influenced by broader market trends and investor sentiment, which could lead to fluctuations.
Confidence Level
Potential Risks
Market corrections and external economic factors could impact the stock's performance.