TSLA Trading Predictions
1 Day Prediction
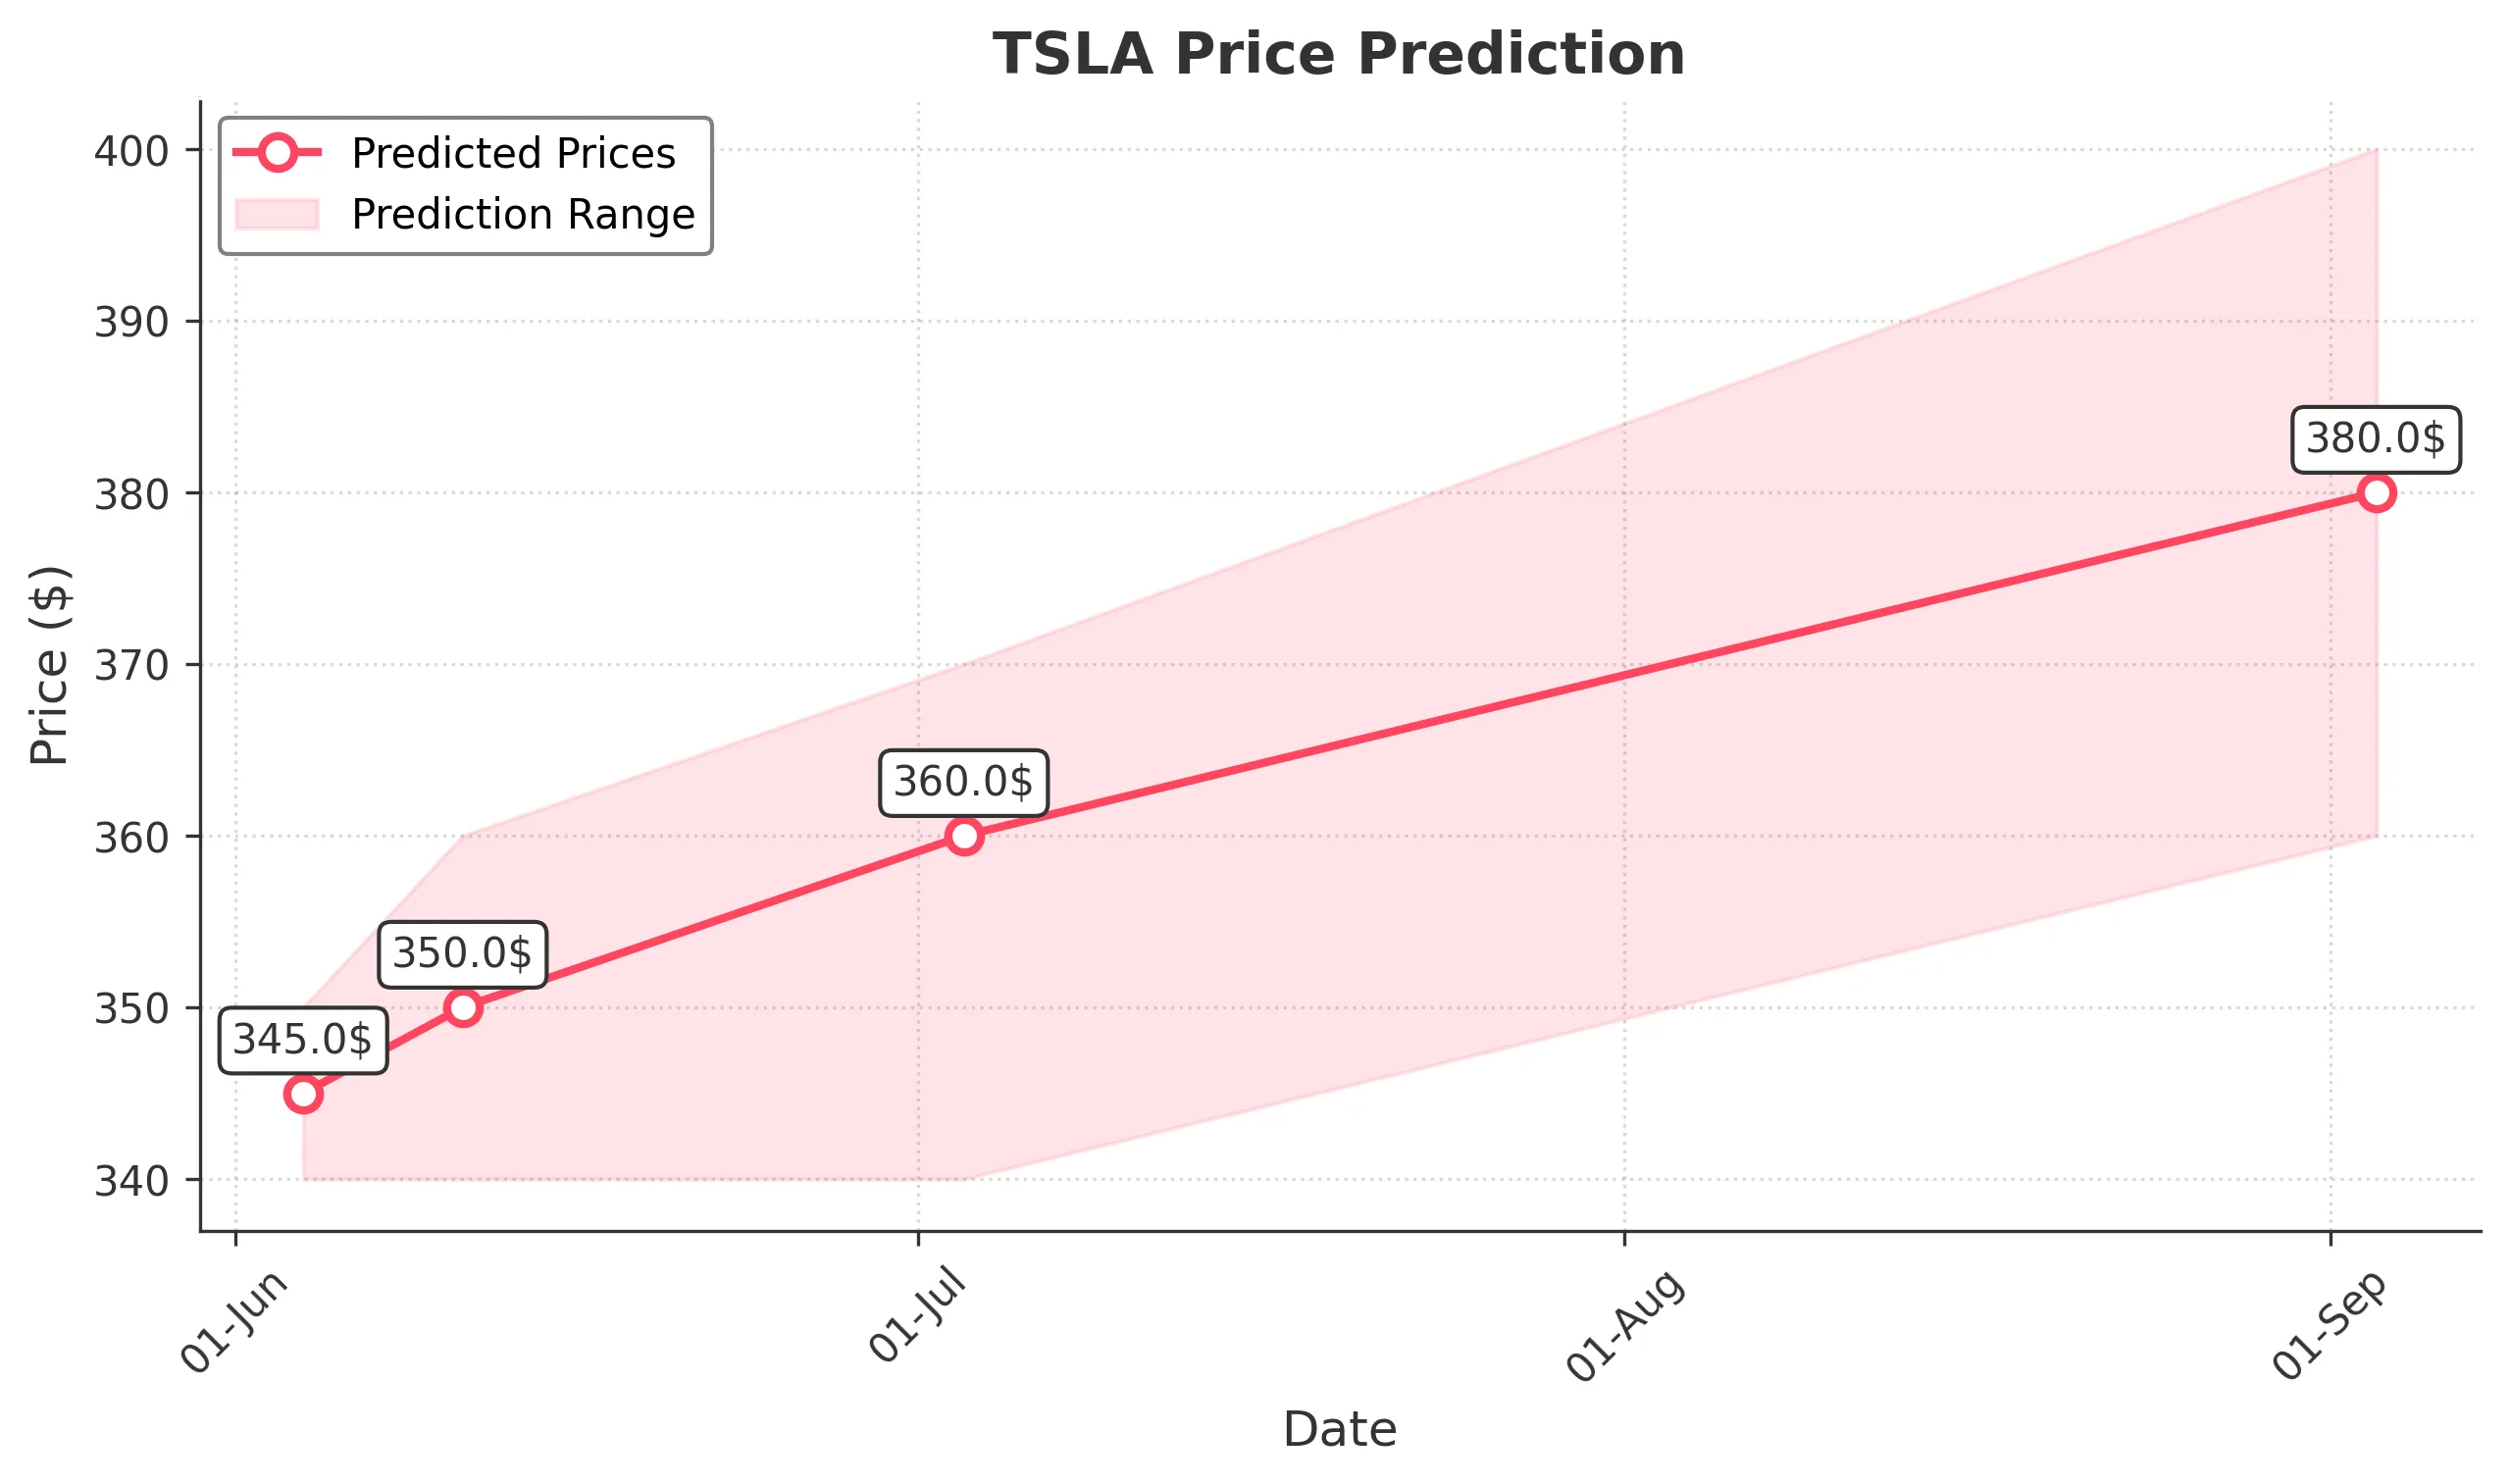
Target: June 4, 2025$345
$343
$350
$340
Description
The stock shows a slight bullish trend with a recent upward movement. The RSI is neutral, indicating potential for further gains. However, the MACD is flattening, suggesting caution. Volume remains steady, supporting the price action.
Analysis
Over the past 3 months, TSLA has shown a bullish trend with significant price recovery from lows. Key support is around $340, while resistance is near $360. The MACD indicates potential consolidation, and volume patterns suggest healthy trading activity.
Confidence Level
Potential Risks
Market volatility and external news could impact the prediction. A sudden downturn in sentiment may lead to a price drop.
1 Week Prediction
Target: June 11, 2025$350
$345
$360
$340
Description
The stock is expected to continue its upward trajectory, supported by recent bullish candlestick patterns. The Bollinger Bands indicate potential for price expansion. However, the RSI nearing overbought levels suggests caution.
Analysis
TSLA has experienced a recovery phase, with key resistance at $360. The recent price action shows bullish candlestick formations, but the RSI indicates overbought conditions. Volume has been consistent, suggesting strong interest.
Confidence Level
Potential Risks
Potential market corrections or negative news could reverse the trend. Watch for any significant changes in volume.
1 Month Prediction
Target: July 3, 2025$360
$355
$370
$340
Description
The stock is likely to maintain its bullish momentum, with strong support at $340. The MACD indicates a bullish crossover, and the RSI is stabilizing. However, external factors could introduce volatility.
Analysis
In the last 3 months, TSLA has shown resilience with a bullish trend. Key support at $340 and resistance at $370 are critical. The MACD and volume patterns suggest a healthy upward movement, but external factors could introduce risks.
Confidence Level
Potential Risks
Economic indicators or earnings reports could impact the stock's performance. Watch for any signs of reversal.
3 Months Prediction
Target: September 3, 2025$380
$370
$400
$360
Description
The stock is projected to continue its upward trend, driven by strong market sentiment and positive technical indicators. The Fibonacci retracement levels suggest potential for further gains, but caution is advised as the RSI approaches overbought territory.
Analysis
TSLA's performance over the past 3 months has been bullish, with significant price recovery. Key support at $360 and resistance at $400 are crucial. The MACD and volume patterns indicate strong buying interest, but external factors could introduce risks.
Confidence Level
Potential Risks
Market corrections or negative news could lead to volatility. The potential for a pullback exists if the stock becomes overextended.