TSLA Trading Predictions
1 Day Prediction
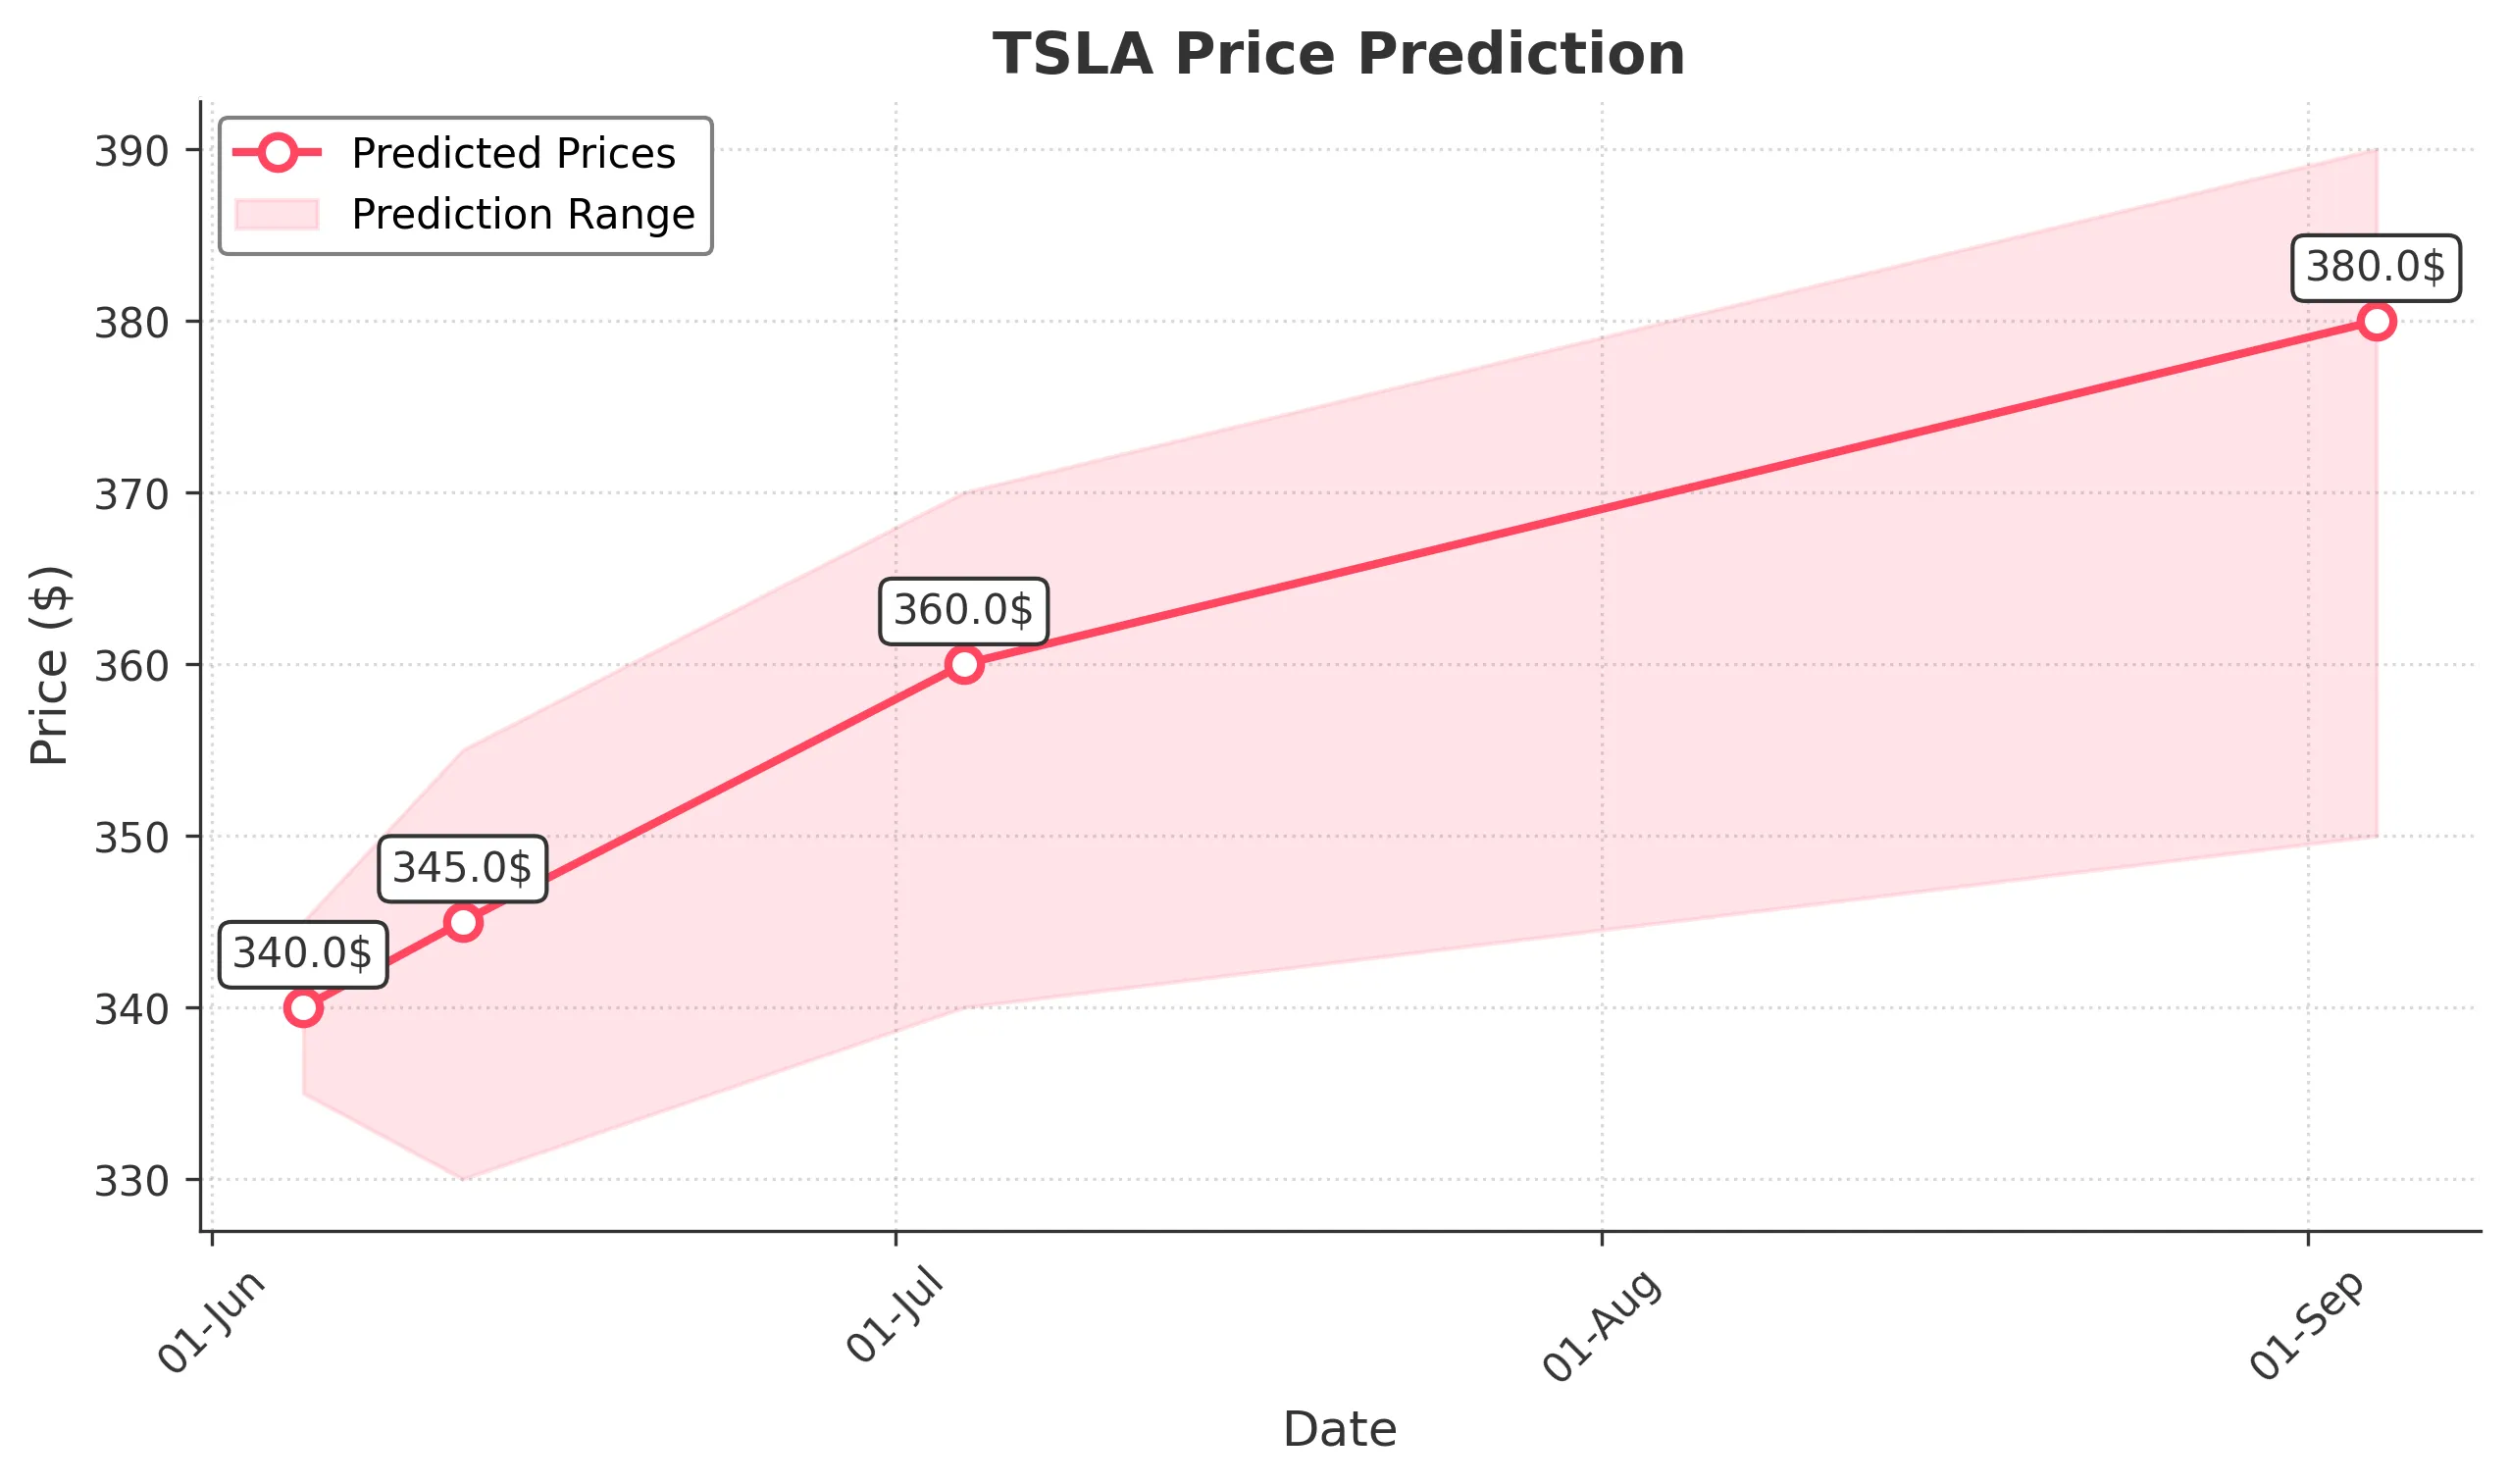
Target: June 5, 2025$340
$341
$345
$335
Description
The stock shows a slight bearish trend with a potential bounce at support around 340. The RSI indicates oversold conditions, suggesting a possible short-term recovery. However, recent volatility and market sentiment remain cautious.
Analysis
Over the past 3 months, TSLA has experienced significant volatility, with a recent bearish trend following a peak. Key support is around 340, while resistance is near 350. The MACD shows a bearish crossover, and volume has been inconsistent, indicating uncertainty.
Confidence Level
Potential Risks
Market volatility and external news could impact the prediction. A sudden downturn could occur if bearish sentiment prevails.
1 Week Prediction
Target: June 12, 2025$345
$340
$355
$330
Description
A potential recovery is expected as the stock approaches key support levels. The RSI may stabilize, and if bullish sentiment returns, we could see a test of resistance at 355. However, caution is warranted due to recent bearish trends.
Analysis
The stock has shown a bearish trend recently, with significant fluctuations. Support at 340 and resistance at 355 are critical. The MACD indicates a potential reversal, but overall market sentiment remains mixed, suggesting caution.
Confidence Level
Potential Risks
Unforeseen macroeconomic events or earnings reports could lead to volatility, impacting the stock's performance.
1 Month Prediction
Target: July 4, 2025$360
$345
$370
$340
Description
If the bullish momentum continues, TSLA could reach 360, supported by positive market sentiment and potential recovery in the tech sector. However, resistance at 370 may pose challenges.
Analysis
The stock has shown signs of recovery, with key support at 340 and resistance at 370. The RSI is improving, indicating potential bullish momentum. However, the overall market remains volatile, and external factors could impact performance.
Confidence Level
Potential Risks
Market corrections or negative news could hinder upward movement, leading to potential declines.
3 Months Prediction
Target: September 4, 2025$380
$360
$390
$350
Description
If the current bullish trend continues, TSLA could reach 380, driven by positive earnings and market sentiment. However, resistance at 390 may limit gains, and external factors could introduce volatility.
Analysis
The stock has shown a mixed performance over the past 3 months, with key support at 350 and resistance at 390. The MACD indicates potential bullish momentum, but market sentiment remains cautious, suggesting a balanced outlook.
Confidence Level
Potential Risks
Potential market corrections or negative news could lead to price declines, impacting the overall prediction.