TSLA Trading Predictions
1 Day Prediction
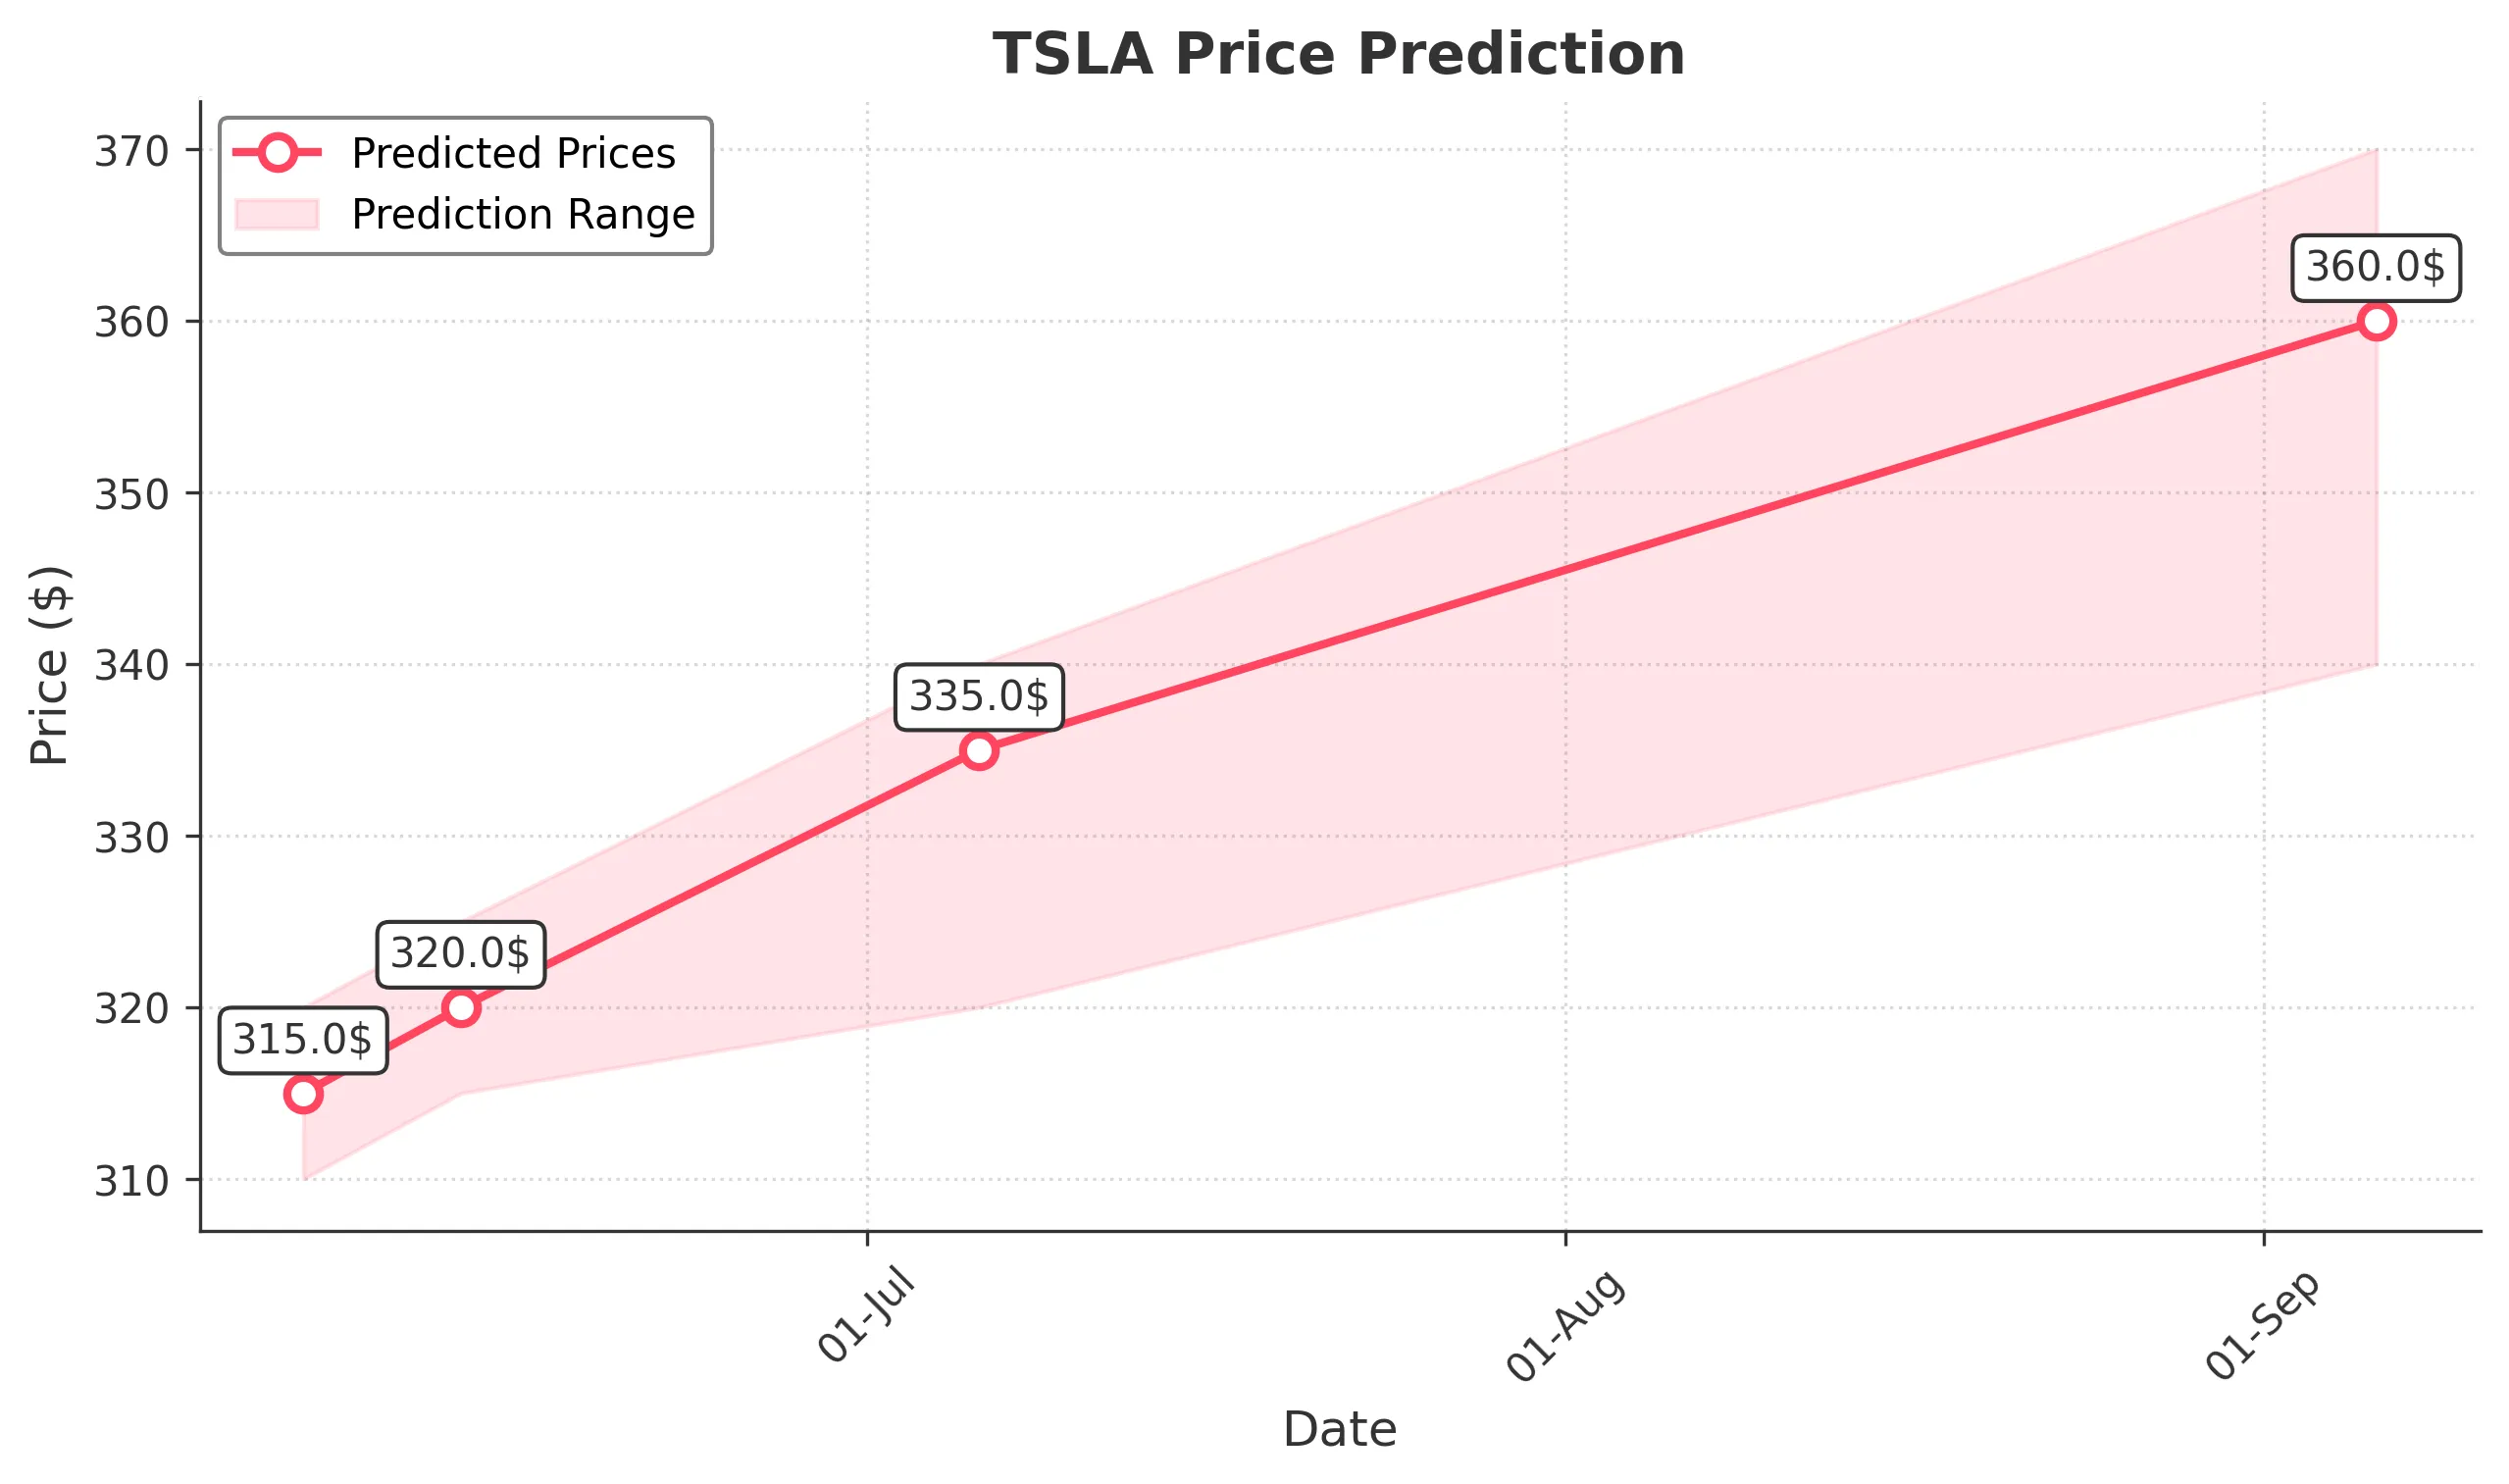
Target: June 6, 2025$315
$317
$320
$310
Description
The stock shows a bearish trend with a recent drop in price. RSI indicates oversold conditions, suggesting a potential bounce. However, MACD is bearish, and volume is declining, indicating caution. Expect a slight recovery but overall weakness.
Analysis
Over the past 3 months, TSLA has experienced significant volatility, with a recent bearish trend. Key support at $310 and resistance at $350. RSI shows oversold conditions, while MACD indicates bearish momentum. Volume patterns suggest declining interest.
Confidence Level
Potential Risks
Market volatility and external news could impact the prediction. A sudden market shift could lead to unexpected price movements.
1 Week Prediction
Target: June 13, 2025$320
$318
$325
$315
Description
A potential recovery is expected as the stock may find support around $310. The RSI is improving, indicating a possible reversal. However, MACD remains bearish, suggesting caution. Volume may increase as traders react to price movements.
Analysis
TSLA has shown a bearish trend recently, with significant price fluctuations. Support at $310 and resistance at $350. The RSI is improving, but MACD remains bearish. Volume patterns indicate a potential increase in trading activity as the stock stabilizes.
Confidence Level
Potential Risks
Unforeseen macroeconomic events or earnings reports could lead to volatility. The bearish MACD signal raises concerns about the sustainability of any upward movement.
1 Month Prediction
Target: July 6, 2025$335
$330
$340
$320
Description
Expect a gradual recovery as the stock stabilizes. The RSI may approach neutral levels, and MACD could show signs of bullish divergence. Volume may increase as market sentiment improves, but caution is advised due to potential resistance.
Analysis
The past 3 months have seen TSLA in a bearish phase, with key support at $310. The stock may be forming a base for recovery, with RSI improving. MACD shows bearish momentum, but a potential reversal could occur if volume increases.
Confidence Level
Potential Risks
Market sentiment can shift quickly, and external factors may impact the stock's performance. The potential for resistance at $350 could limit upward movement.
3 Months Prediction
Target: September 6, 2025$360
$355
$370
$340
Description
A bullish trend may develop as the stock breaks above resistance levels. Improved market sentiment and potential positive news could drive prices higher. Watch for volume spikes as confirmation of the trend.
Analysis
TSLA's performance over the last 3 months has been volatile, with a bearish trend recently. Key support at $310 and resistance at $350. If the stock can break through resistance, a bullish trend may emerge, supported by improving RSI and MACD signals.
Confidence Level
Potential Risks
Economic conditions and competitive pressures in the EV market could impact performance. A failure to break resistance could lead to a reversal.