TSLA Trading Predictions
1 Day Prediction
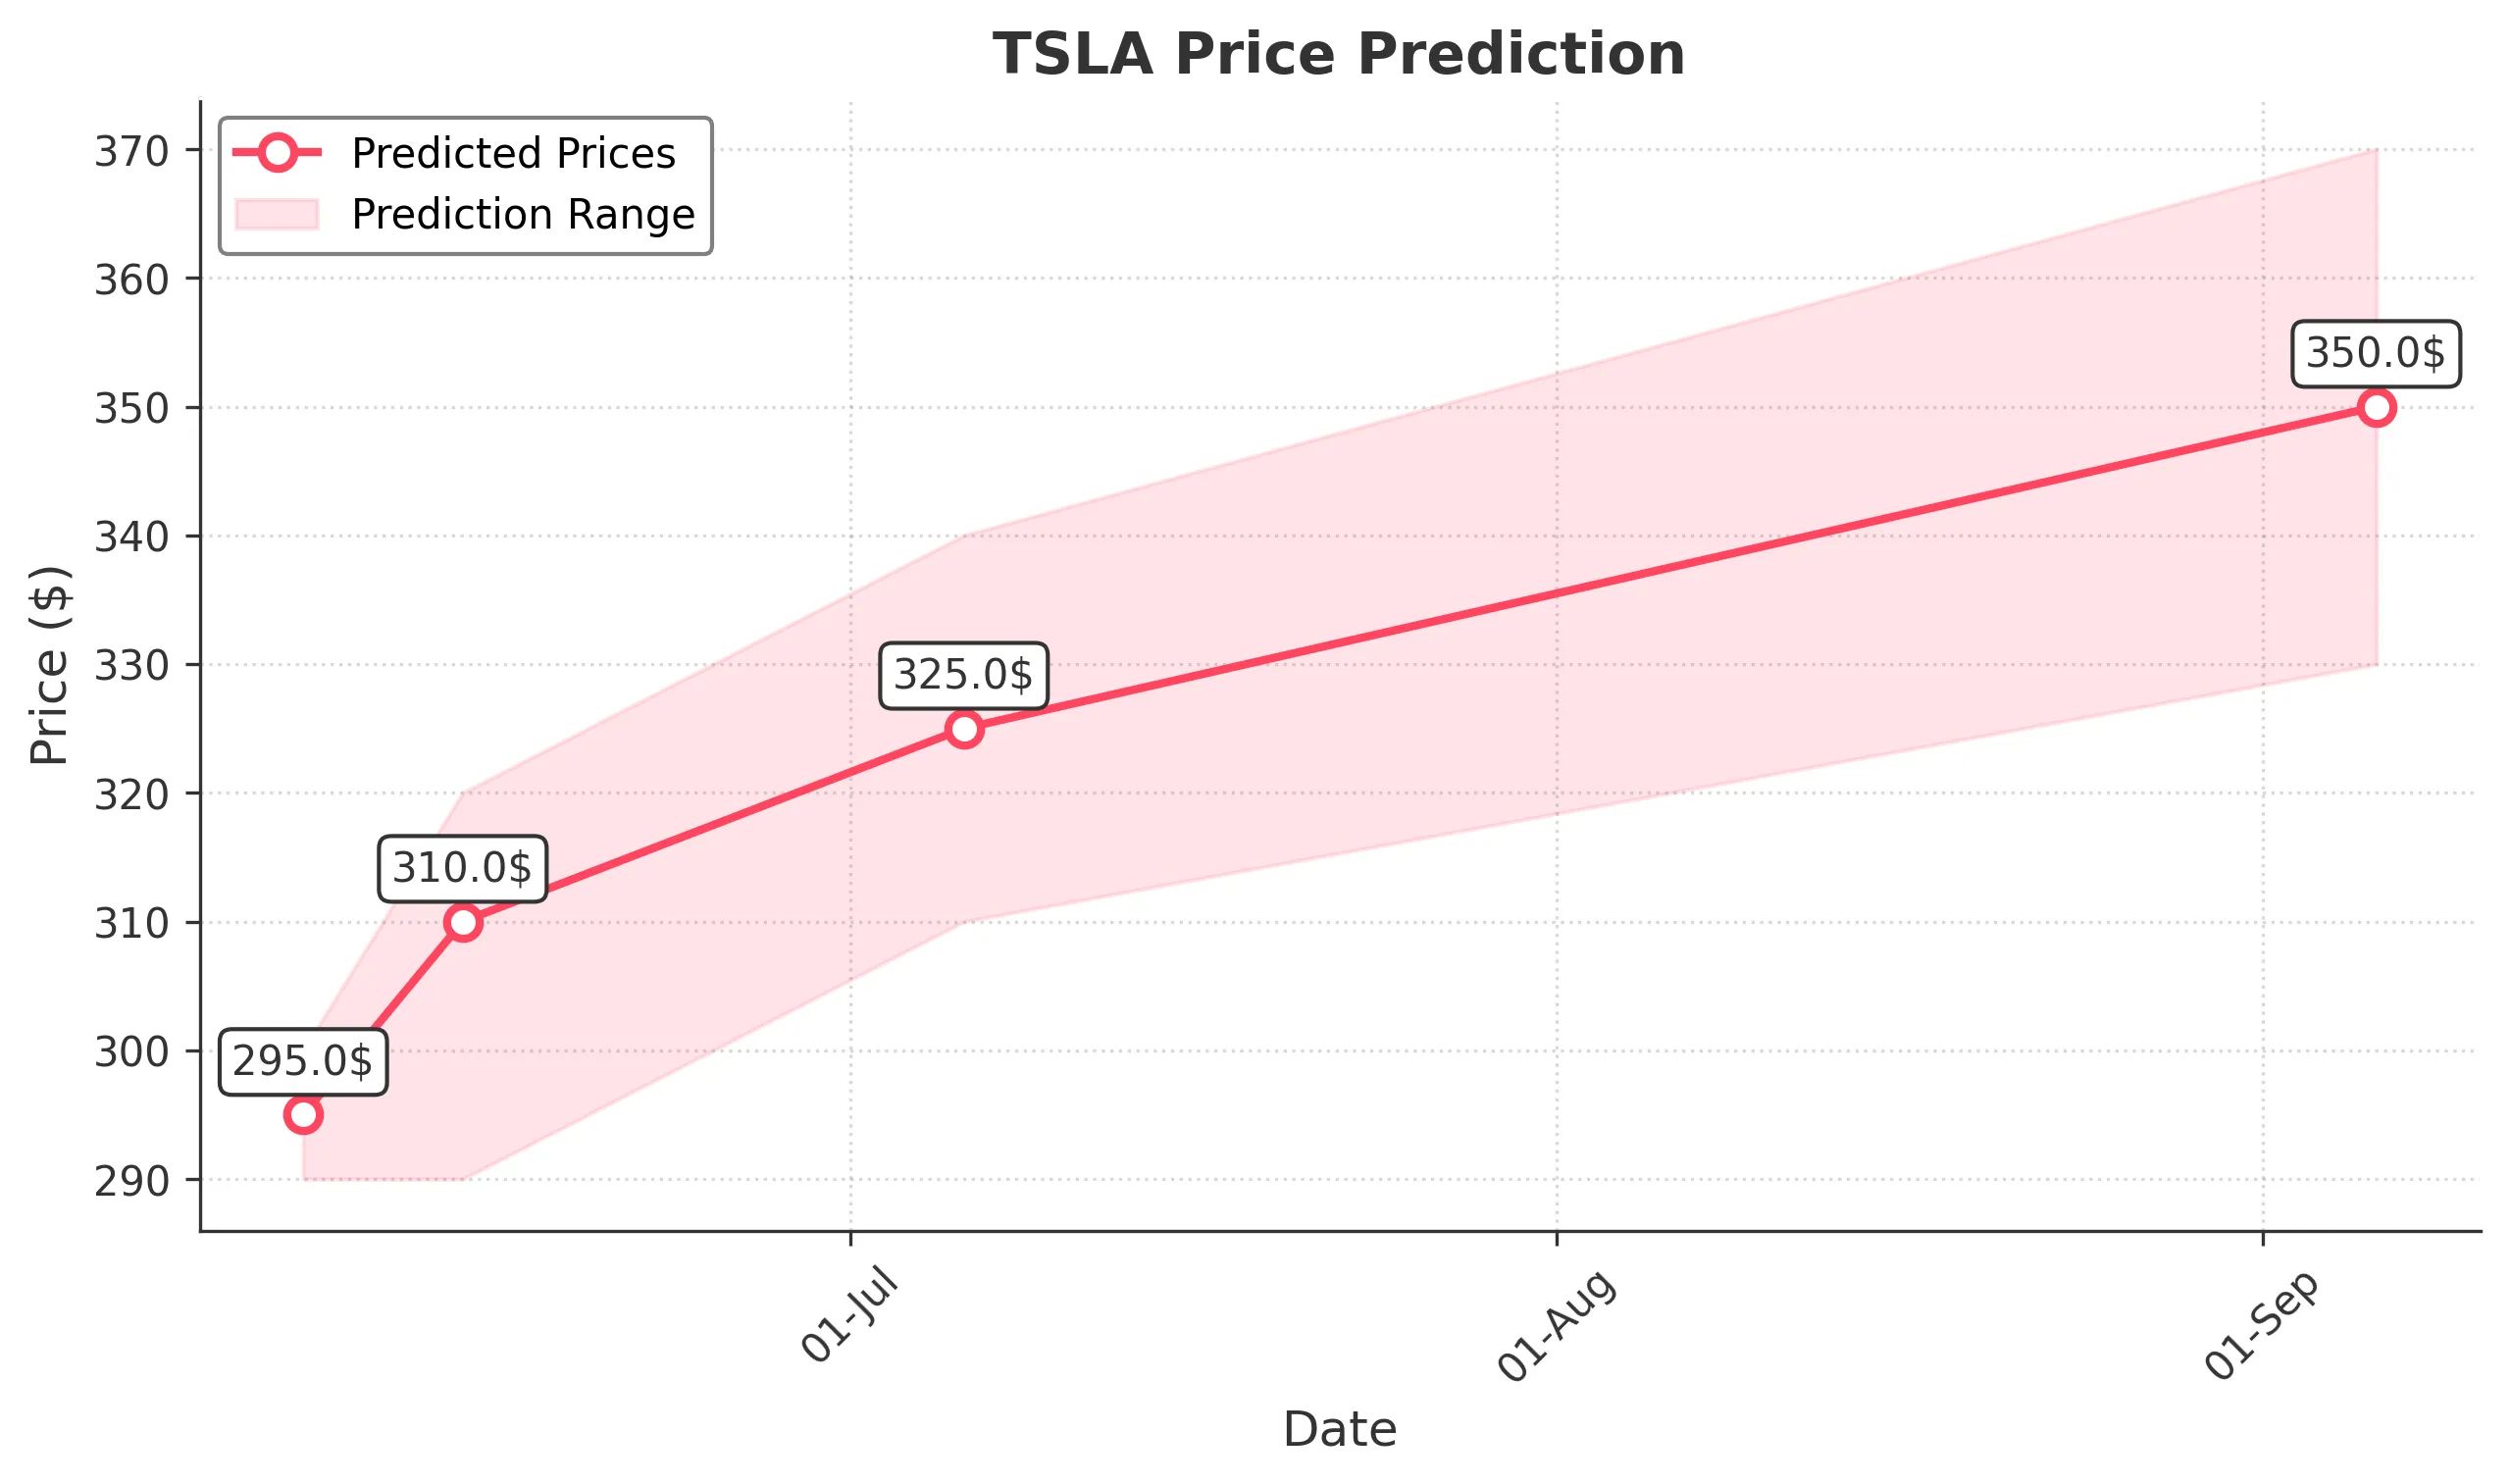
Target: June 7, 2025$295
$294
$300
$290
Description
The stock shows a slight bullish trend with a potential bounce from recent lows. RSI indicates oversold conditions, while MACD is showing a bullish crossover. However, volatility remains high, suggesting caution.
Analysis
Over the past 3 months, TSLA has experienced significant volatility, with a recent bearish trend followed by a recovery. Key support at $284 and resistance at $362. Technical indicators show mixed signals, with RSI fluctuating and MACD indicating potential bullish momentum.
Confidence Level
Potential Risks
Market sentiment could shift due to macroeconomic news or earnings reports, which may impact the prediction.
1 Week Prediction
Target: June 14, 2025$310
$295
$320
$290
Description
Expect a gradual recovery as bullish sentiment builds. The recent price action suggests a potential reversal, supported by Fibonacci retracement levels. However, watch for resistance at $320.
Analysis
The stock has shown a recovery from recent lows, with key support at $284. The MACD is turning bullish, but the RSI indicates potential overbought conditions. Volume spikes suggest increased interest, but caution is warranted.
Confidence Level
Potential Risks
Uncertainty in broader market conditions and potential earnings surprises could lead to volatility.
1 Month Prediction
Target: July 6, 2025$325
$315
$340
$310
Description
A bullish trend is anticipated as the stock stabilizes above key support levels. The MACD and RSI suggest upward momentum, but external factors could introduce volatility.
Analysis
TSLA has shown resilience with a recent upward trend. Key support at $310 and resistance at $340. Technical indicators are bullish, with increasing volume suggesting strong interest. However, macroeconomic factors could influence future performance.
Confidence Level
Potential Risks
Potential market corrections or negative news could impact the stock's performance.
3 Months Prediction
Target: September 6, 2025$350
$340
$370
$330
Description
Long-term bullish outlook as the stock is expected to break through resistance levels. Positive market sentiment and strong fundamentals support this prediction, but external shocks could pose risks.
Analysis
Over the last three months, TSLA has shown significant fluctuations, with a recent bullish trend. Key support at $330 and resistance at $370. Technical indicators suggest a potential breakout, but external factors could introduce uncertainty.
Confidence Level
Potential Risks
Market volatility and economic conditions could lead to unexpected price movements.