TSLA Trading Predictions
1 Day Prediction
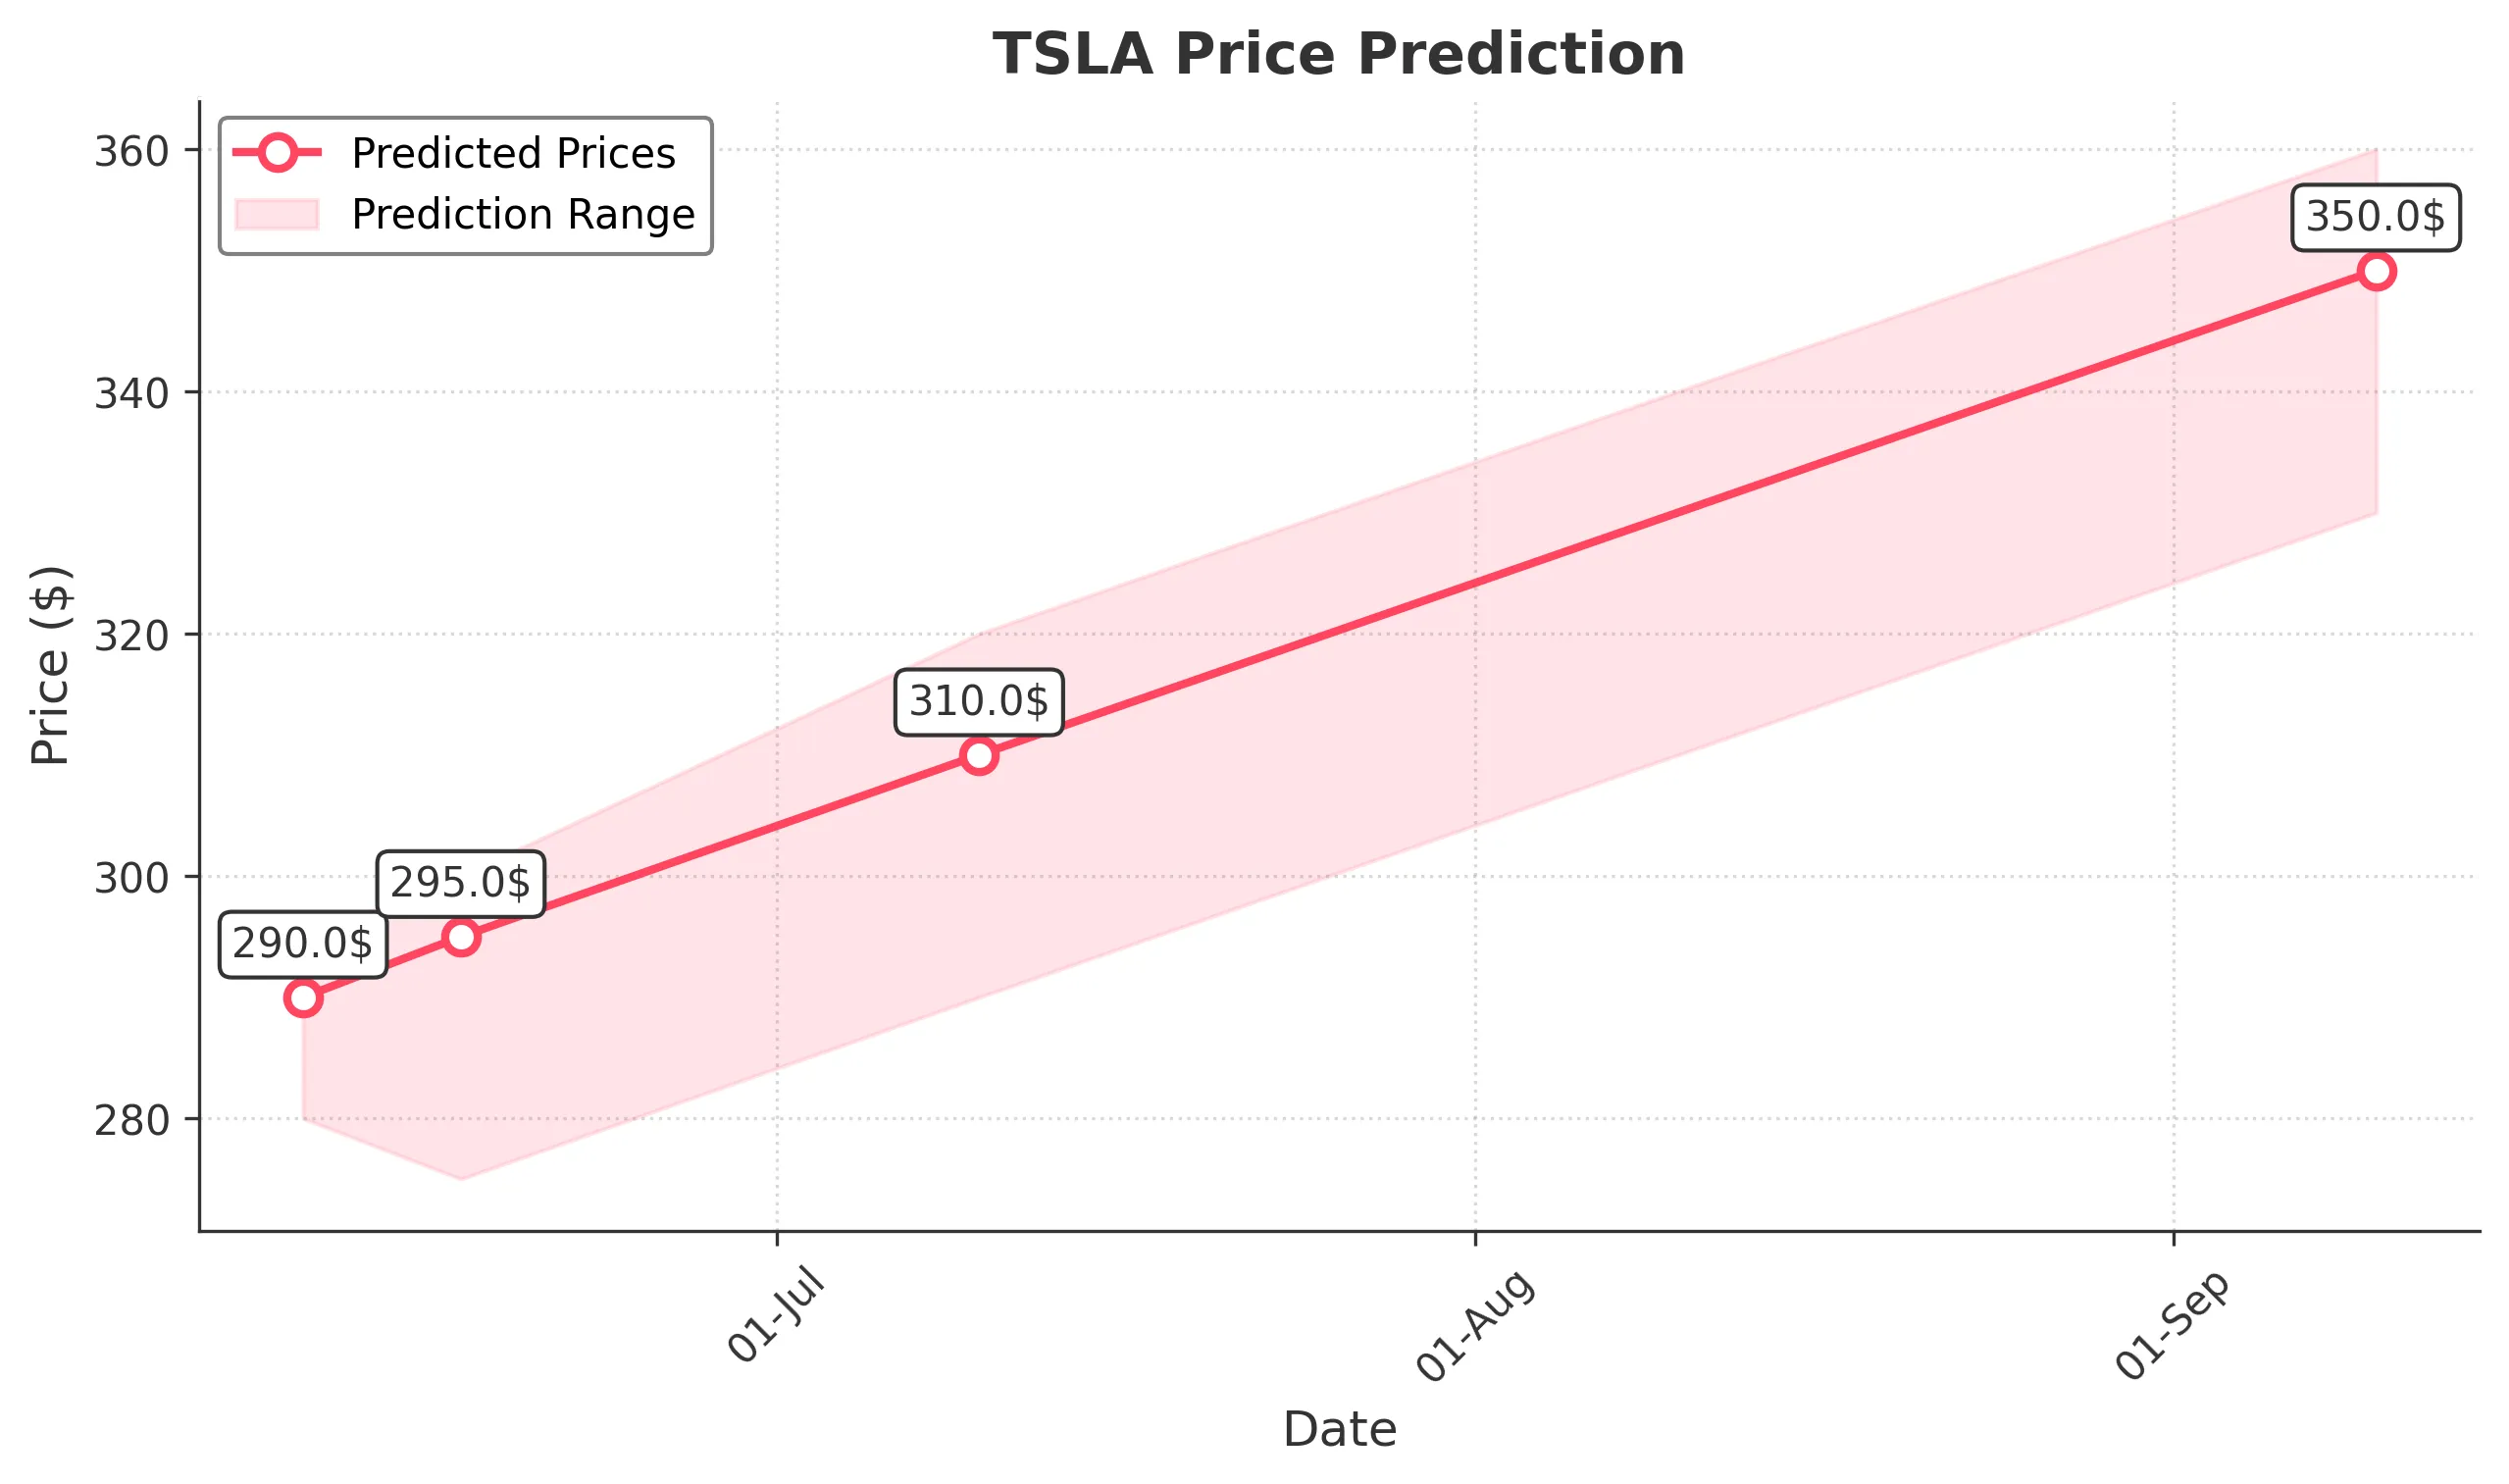
Target: June 10, 2025$290
$285
$295
$280
Description
The stock shows a potential rebound after recent declines, supported by a bullish candlestick pattern. RSI indicates oversold conditions, suggesting a possible upward correction. However, volatility remains high, which could lead to fluctuations.
Analysis
Over the past 3 months, TSLA has experienced significant volatility, with a recent bearish trend. Key support at $280 has held, while resistance is seen around $350. Moving averages indicate a potential reversal, but high volume spikes suggest uncertainty.
Confidence Level
Potential Risks
Market sentiment is mixed, and external factors could impact the stock's performance. A sudden negative news event could reverse the predicted trend.
1 Week Prediction
Target: June 17, 2025$295
$290
$300
$275
Description
A slight upward trend is expected as the stock stabilizes. The MACD shows a bullish crossover, and the RSI is recovering from oversold levels. However, market volatility remains a concern, which could affect price stability.
Analysis
TSLA has shown a bearish trend recently, with significant price fluctuations. Support at $280 is critical, while resistance at $350 remains a challenge. Technical indicators suggest a possible recovery, but external factors could lead to further declines.
Confidence Level
Potential Risks
Potential market corrections or negative news could impact the stock's upward momentum. Watch for volume spikes that may indicate selling pressure.
1 Month Prediction
Target: July 10, 2025$310
$295
$320
$290
Description
Expect a gradual recovery as the stock finds support. The bullish divergence in RSI and MACD suggests potential upward movement. However, macroeconomic factors and market sentiment could introduce volatility.
Analysis
The past three months have seen TSLA's price fluctuate significantly, with a bearish trend recently. Key support at $280 and resistance at $350 are critical levels. Technical indicators suggest a potential recovery, but external factors could lead to further volatility.
Confidence Level
Potential Risks
Economic indicators and potential market corrections could hinder growth. Watch for changes in trading volume that may signal shifts in investor sentiment.
3 Months Prediction
Target: September 10, 2025$350
$340
$360
$330
Description
A bullish outlook is anticipated as the stock stabilizes and recovers. The long-term trend shows potential for growth, supported by positive market sentiment and technical indicators. However, macroeconomic conditions could still pose risks.
Analysis
TSLA has experienced high volatility over the past three months, with significant price swings. The stock is currently at a critical juncture, with support at $280 and resistance at $350. Technical indicators suggest a potential bullish trend, but external factors could lead to further fluctuations.
Confidence Level
Potential Risks
Unforeseen economic events or changes in market sentiment could impact the stock's performance. Monitor for any significant news that may affect investor confidence.