TSLA Trading Predictions
1 Day Prediction
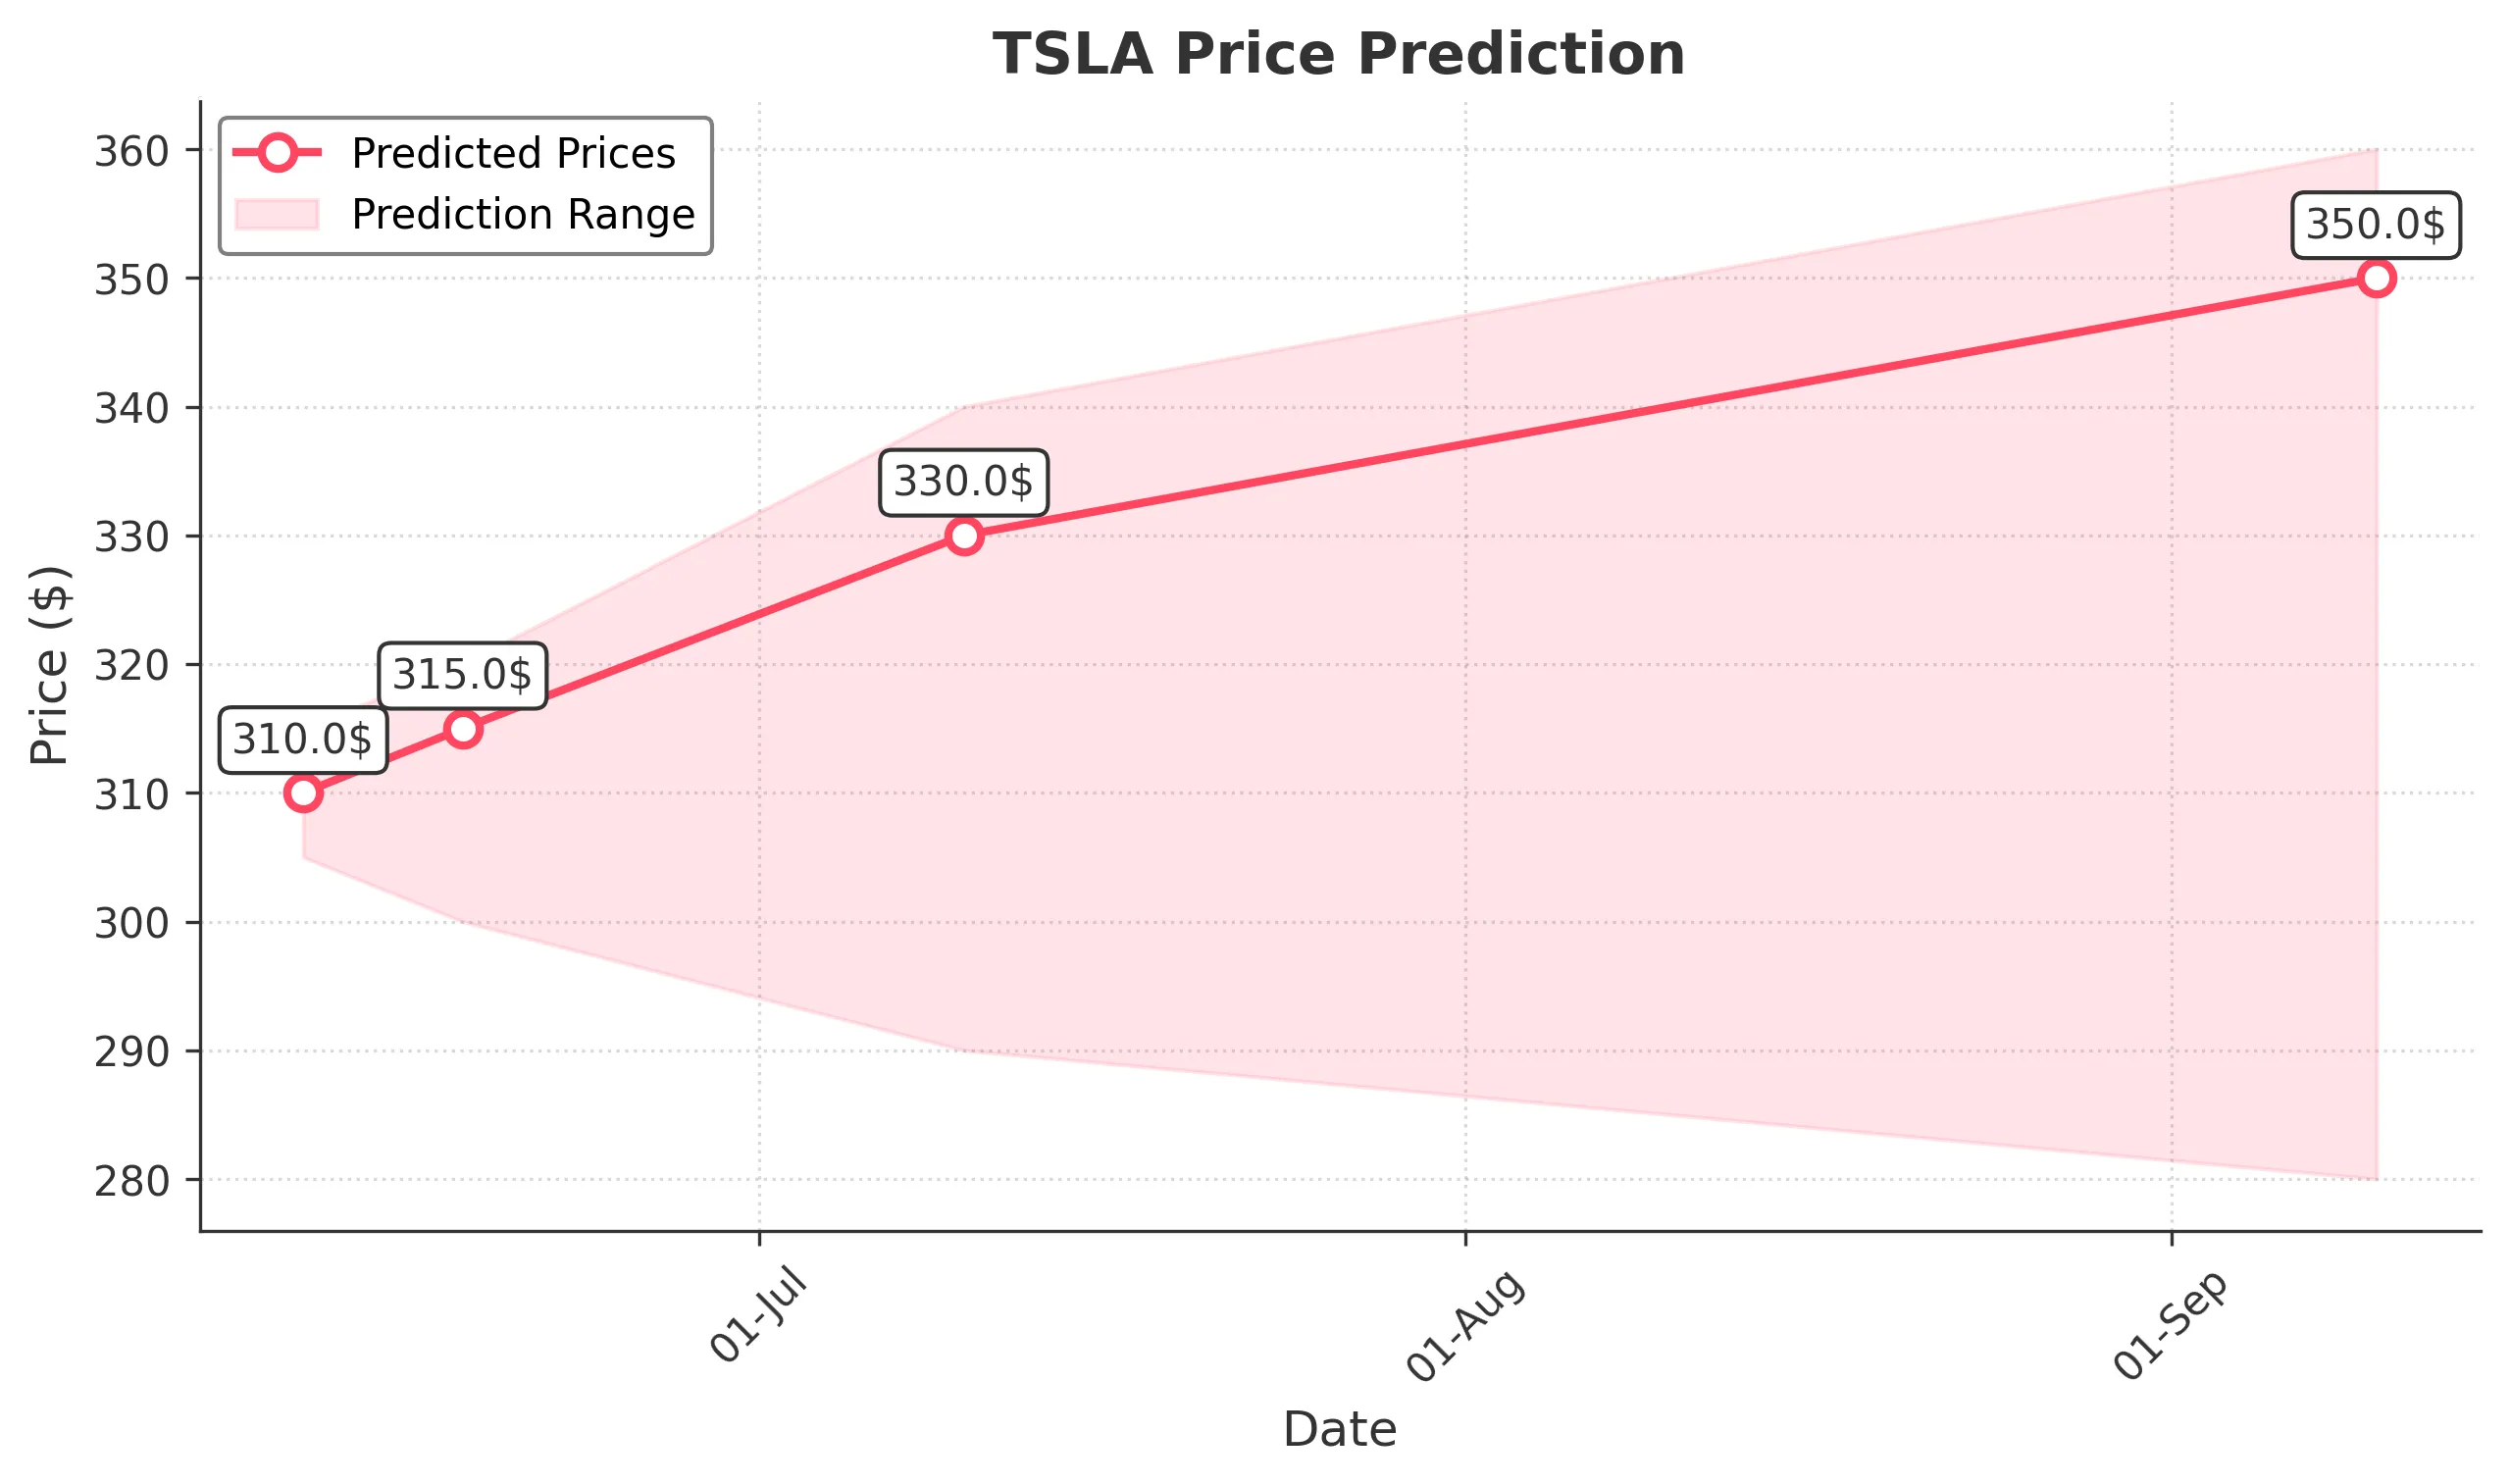
Target: June 11, 2025$310
$312
$315
$305
Description
The stock shows a bullish trend with a recent upward movement. The RSI is approaching overbought levels, indicating potential for a pullback. However, strong buying volume suggests continued momentum. Watch for resistance at $315.
Analysis
Over the past 3 months, TSLA has shown a bullish trend with significant price increases. Key support at $280 and resistance at $315. Volume spikes indicate strong interest. Recent candlestick patterns suggest bullish continuation, but volatility remains a concern.
Confidence Level
Potential Risks
Potential for a pullback due to overbought RSI. Market sentiment could shift quickly.
1 Week Prediction
Target: June 18, 2025$315
$310
$320
$300
Description
The upward trend is expected to continue, but with potential volatility. The MACD shows bullish momentum, while the Bollinger Bands indicate a squeeze, suggesting a breakout. Watch for support at $300.
Analysis
TSLA has experienced significant gains, with a recent high of $362. Key support at $300 and resistance at $320. The MACD and RSI indicate bullish momentum, but the market's reaction to macroeconomic events could introduce uncertainty.
Confidence Level
Potential Risks
Market volatility and external factors could impact price. Watch for news that may affect sentiment.
1 Month Prediction
Target: July 10, 2025$330
$315
$340
$290
Description
Expect continued bullish momentum, but with potential corrections. Fibonacci retracement levels suggest $330 as a target. Watch for market sentiment shifts that could lead to volatility.
Analysis
The stock has shown strong upward movement, with key support at $290 and resistance at $340. The RSI indicates potential overbought conditions, and volume patterns suggest strong interest. However, macroeconomic factors could introduce volatility.
Confidence Level
Potential Risks
Potential for market corrections and external economic factors could impact the prediction.
3 Months Prediction
Target: September 10, 2025$350
$330
$360
$280
Description
Long-term bullish outlook, but expect fluctuations. The stock may face resistance at $360. Market sentiment and economic conditions will play a crucial role in price movements.
Analysis
TSLA has shown a strong bullish trend, but the market is volatile. Key support at $280 and resistance at $360. The stock's performance will depend on macroeconomic factors and market sentiment, which could lead to fluctuations.
Confidence Level
Potential Risks
Long-term predictions are subject to greater uncertainty due to potential market shifts and economic changes.