TSLA Trading Predictions
1 Day Prediction
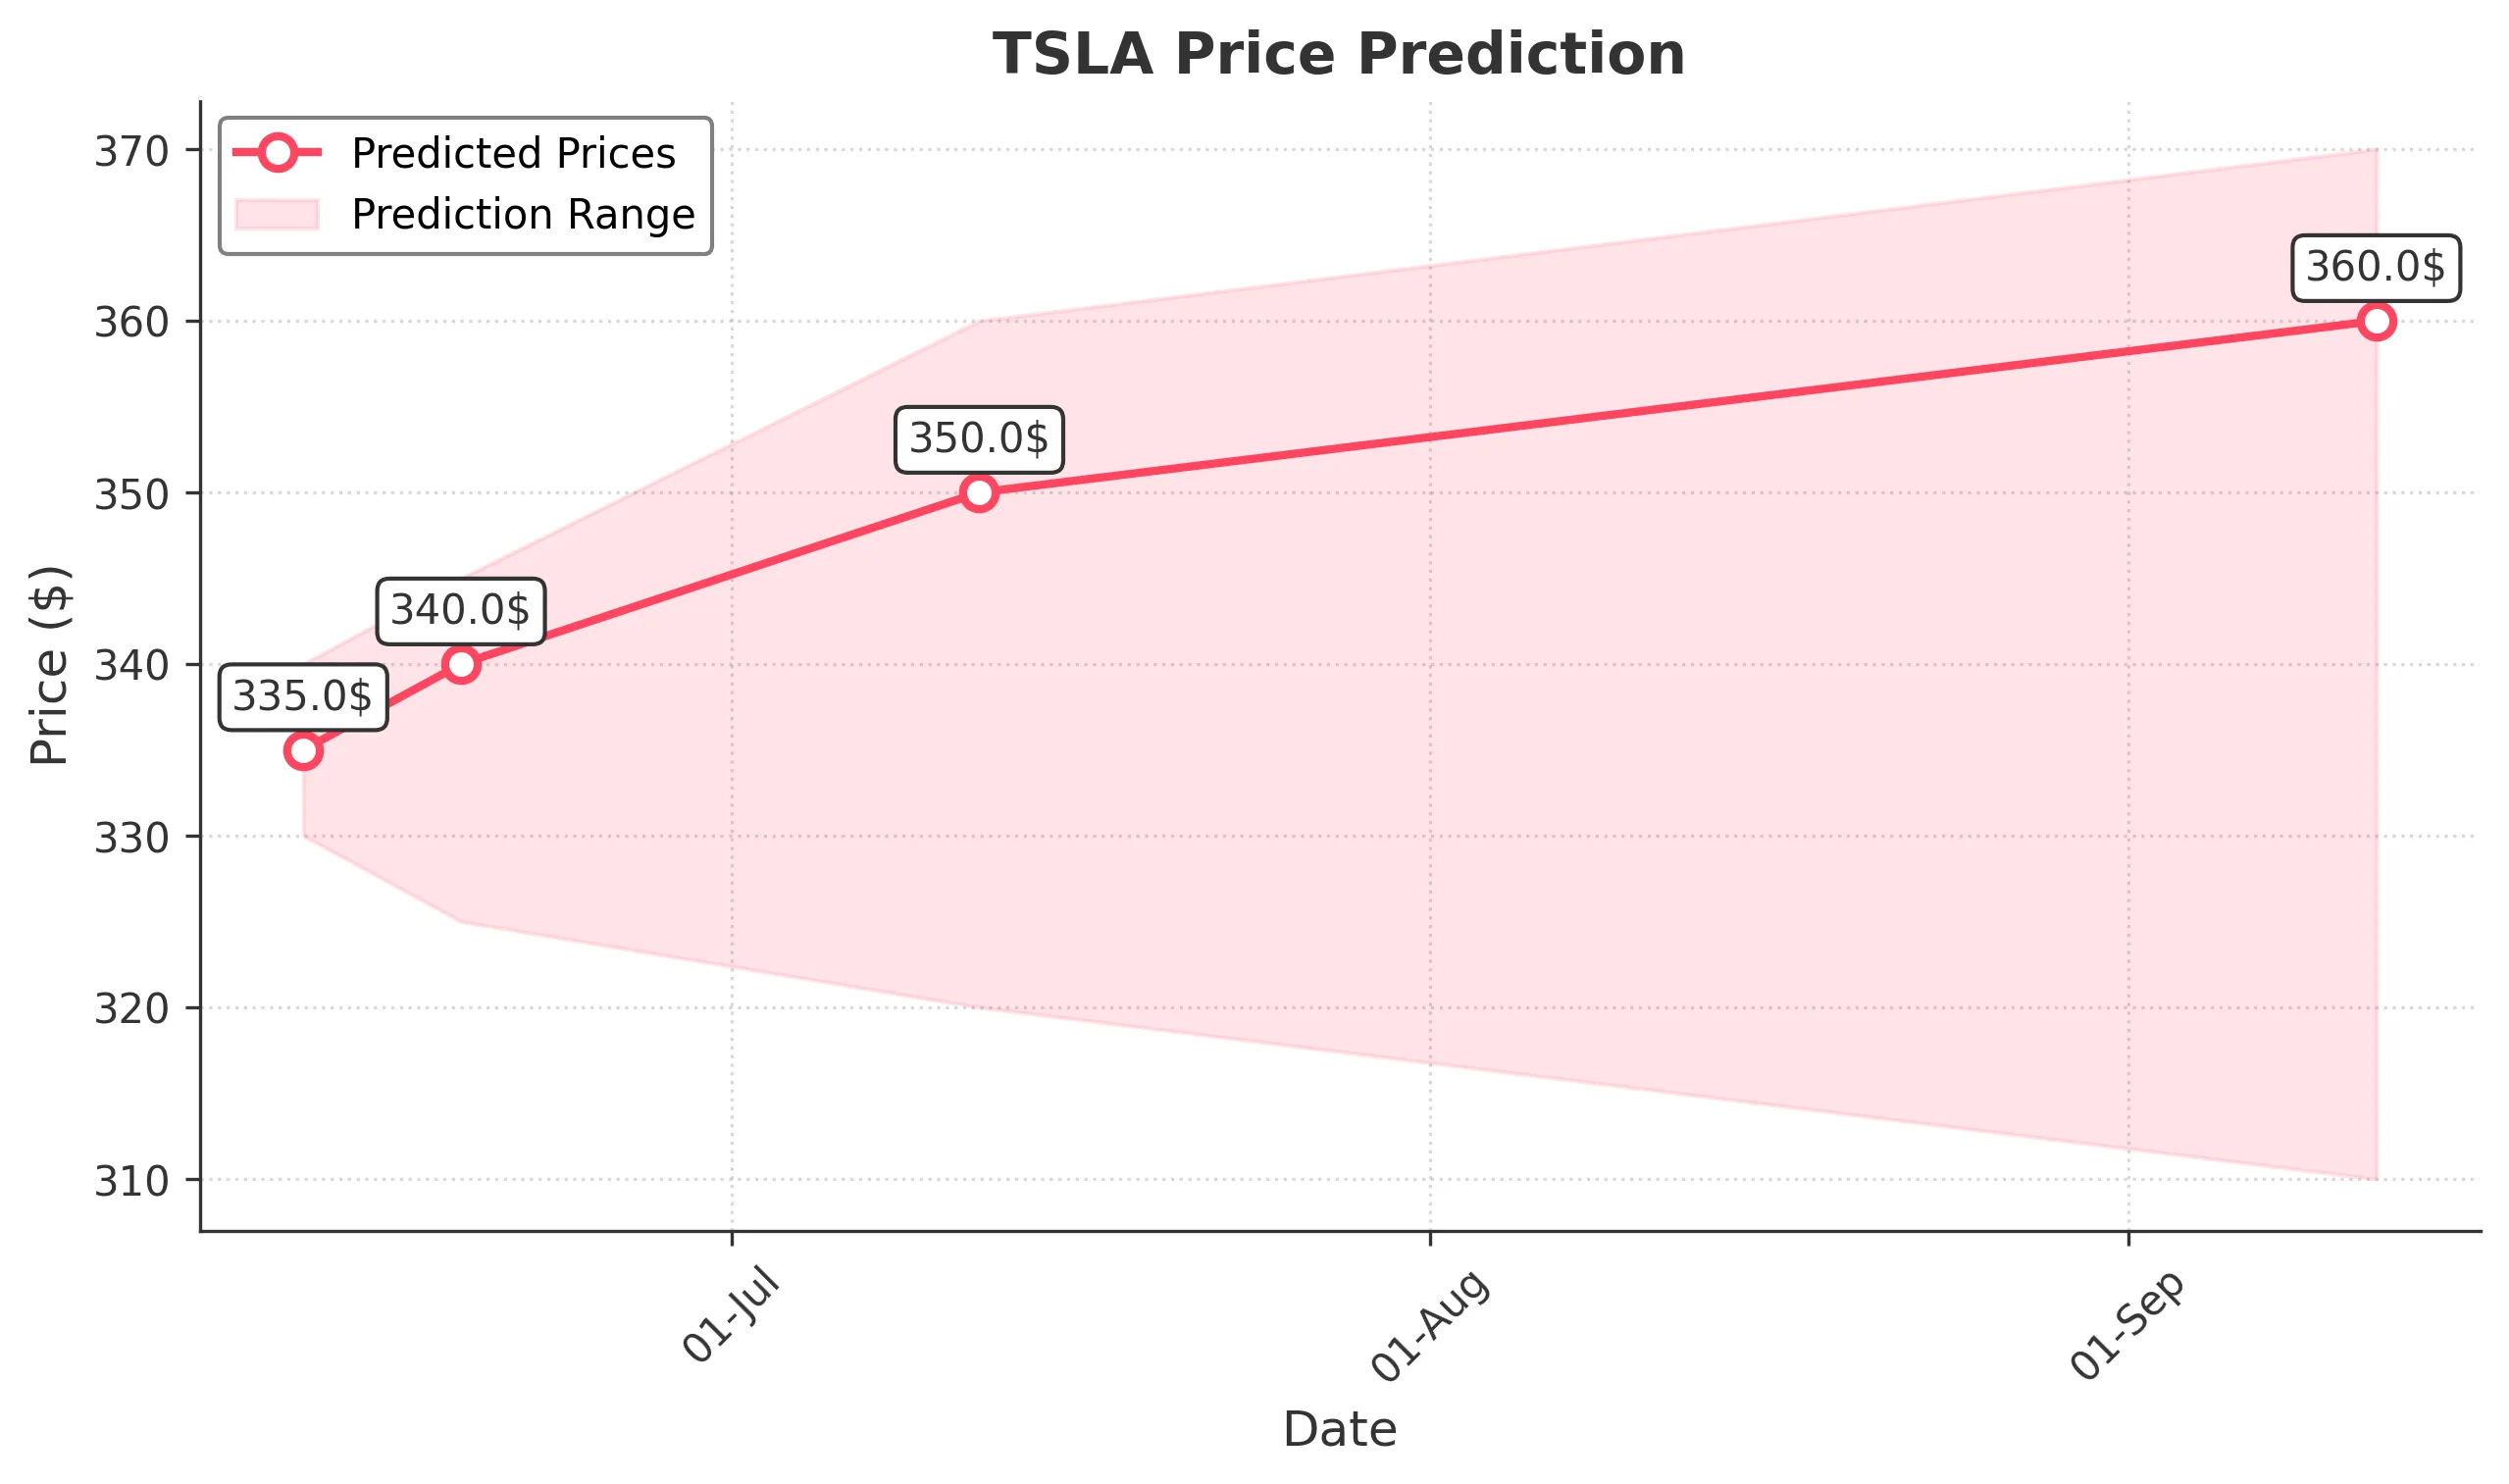
Target: June 12, 2025$335
$334
$340
$330
Description
The stock shows a bullish trend with a recent upward movement. The RSI is approaching overbought levels, indicating potential for a pullback. However, strong volume suggests continued interest. Expect a close around 335.
Analysis
TSLA has shown a bullish trend over the past 3 months, with significant support at 330 and resistance around 350. Recent volume spikes indicate strong buying interest, but the RSI nearing overbought levels suggests caution.
Confidence Level
Potential Risks
Potential for a pullback due to overbought RSI and market volatility.
1 Week Prediction
Target: June 19, 2025$340
$335
$345
$325
Description
The stock is expected to maintain its upward momentum, but with potential volatility. The MACD shows bullish signals, yet the RSI indicates overbought conditions. A close around 340 is likely.
Analysis
Over the past 3 months, TSLA has experienced a bullish trend with key support at 330. The MACD is bullish, but the RSI suggests caution. Volume patterns indicate strong interest, but external market factors could introduce volatility.
Confidence Level
Potential Risks
Market sentiment could shift, leading to increased volatility and potential price corrections.
1 Month Prediction
Target: July 12, 2025$350
$340
$360
$320
Description
Expect continued bullish momentum, with potential for a breakout above 350. However, the RSI indicates overbought conditions, suggesting a possible pullback. A close around 350 is anticipated.
Analysis
TSLA has shown strong upward movement, with resistance at 350. The MACD remains bullish, but the RSI indicates overbought conditions. Volume trends are strong, but external factors could lead to volatility.
Confidence Level
Potential Risks
Market corrections and external economic factors could impact the stock's performance.
3 Months Prediction
Target: September 12, 2025$360
$350
$370
$310
Description
While the stock shows potential for growth, macroeconomic factors and market sentiment could lead to volatility. A close around 360 is expected, but watch for potential corrections.
Analysis
The past 3 months have seen a bullish trend, but with increasing volatility. Key support is at 310, while resistance is at 370. The MACD is bullish, but the RSI suggests caution. Volume patterns indicate strong interest, but external factors could introduce risk.
Confidence Level
Potential Risks
Unforeseen economic events and market sentiment shifts could significantly impact the stock's trajectory.