TSLA Trading Predictions
1 Day Prediction
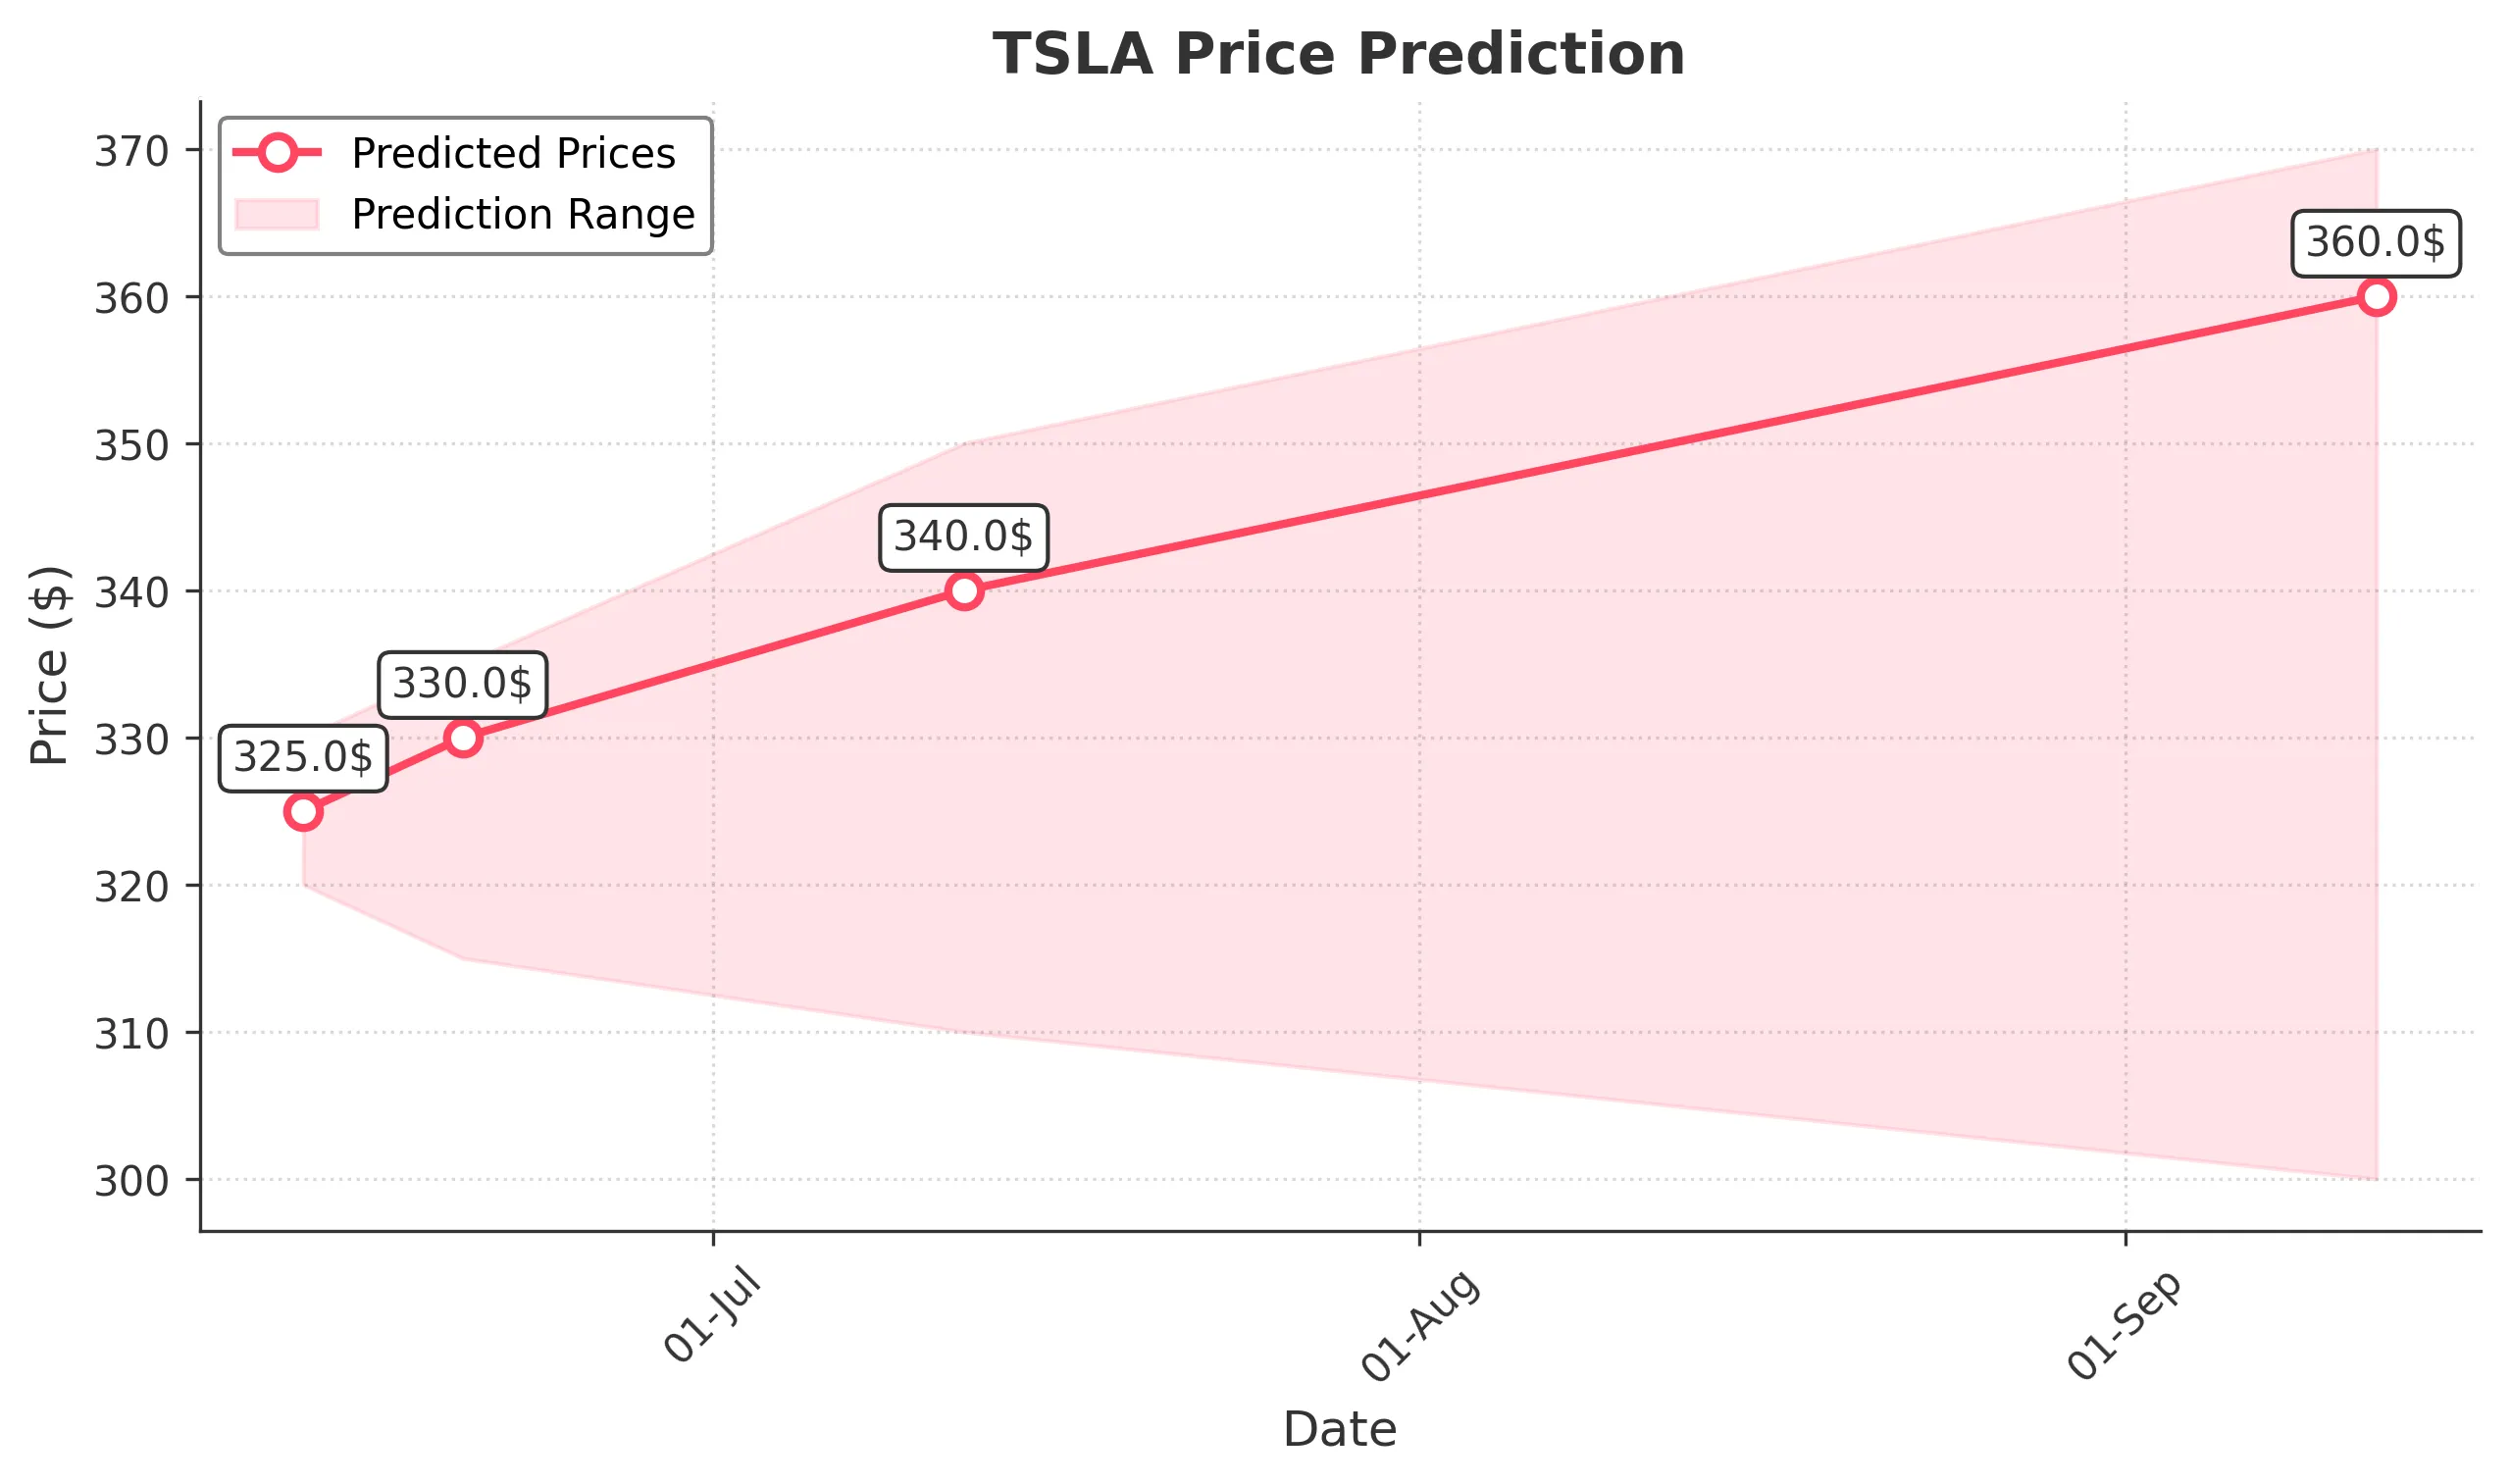
Target: June 13, 2025$325
$324
$330
$320
Description
The stock shows a slight bullish trend with a recent Doji candlestick indicating indecision. RSI is neutral, and MACD is close to crossing above the signal line, suggesting potential upward momentum. However, volatility remains high.
Analysis
Over the past 3 months, TSLA has shown a bullish trend with significant price fluctuations. Key support is around $320, while resistance is near $350. Volume spikes indicate strong interest, but recent volatility raises concerns about potential pullbacks.
Confidence Level
Potential Risks
Market sentiment could shift due to macroeconomic news or earnings reports, which may impact the stock's performance.
1 Week Prediction
Target: June 20, 2025$330
$325
$335
$315
Description
The stock is expected to continue its upward trajectory, supported by a bullish MACD crossover and a recent bullish engulfing pattern. However, the RSI is approaching overbought territory, indicating potential for a pullback.
Analysis
TSLA has experienced significant volatility, with a recent bullish trend. Key support at $320 and resistance at $350. The stock's performance is influenced by broader market trends and investor sentiment, which remain mixed.
Confidence Level
Potential Risks
Potential market corrections or negative news could lead to a sudden drop in price, affecting the prediction.
1 Month Prediction
Target: July 12, 2025$340
$335
$350
$310
Description
Expect a gradual increase in price as bullish momentum builds. The Fibonacci retracement levels suggest a target around $340, but overbought conditions may lead to corrections. Watch for volume spikes indicating strong buying interest.
Analysis
The stock has shown a bullish trend with significant price movements. Key support at $310 and resistance at $350. Technical indicators suggest potential upward movement, but market volatility and external factors could lead to price corrections.
Confidence Level
Potential Risks
Unforeseen macroeconomic events or earnings surprises could significantly impact stock performance.
3 Months Prediction
Target: September 12, 2025$360
$350
$370
$300
Description
Long-term bullish outlook supported by strong fundamentals and market sentiment. However, potential resistance at $370 may lead to short-term pullbacks. Monitor for any changes in macroeconomic conditions that could affect the stock.
Analysis
TSLA has shown a strong bullish trend over the past months, with significant price fluctuations. Key support at $300 and resistance at $370. The stock's performance is influenced by broader market trends, investor sentiment, and potential macroeconomic events.
Confidence Level
Potential Risks
Market volatility and economic uncertainties could lead to unexpected price movements, impacting the prediction.