TSLA Trading Predictions
1 Day Prediction
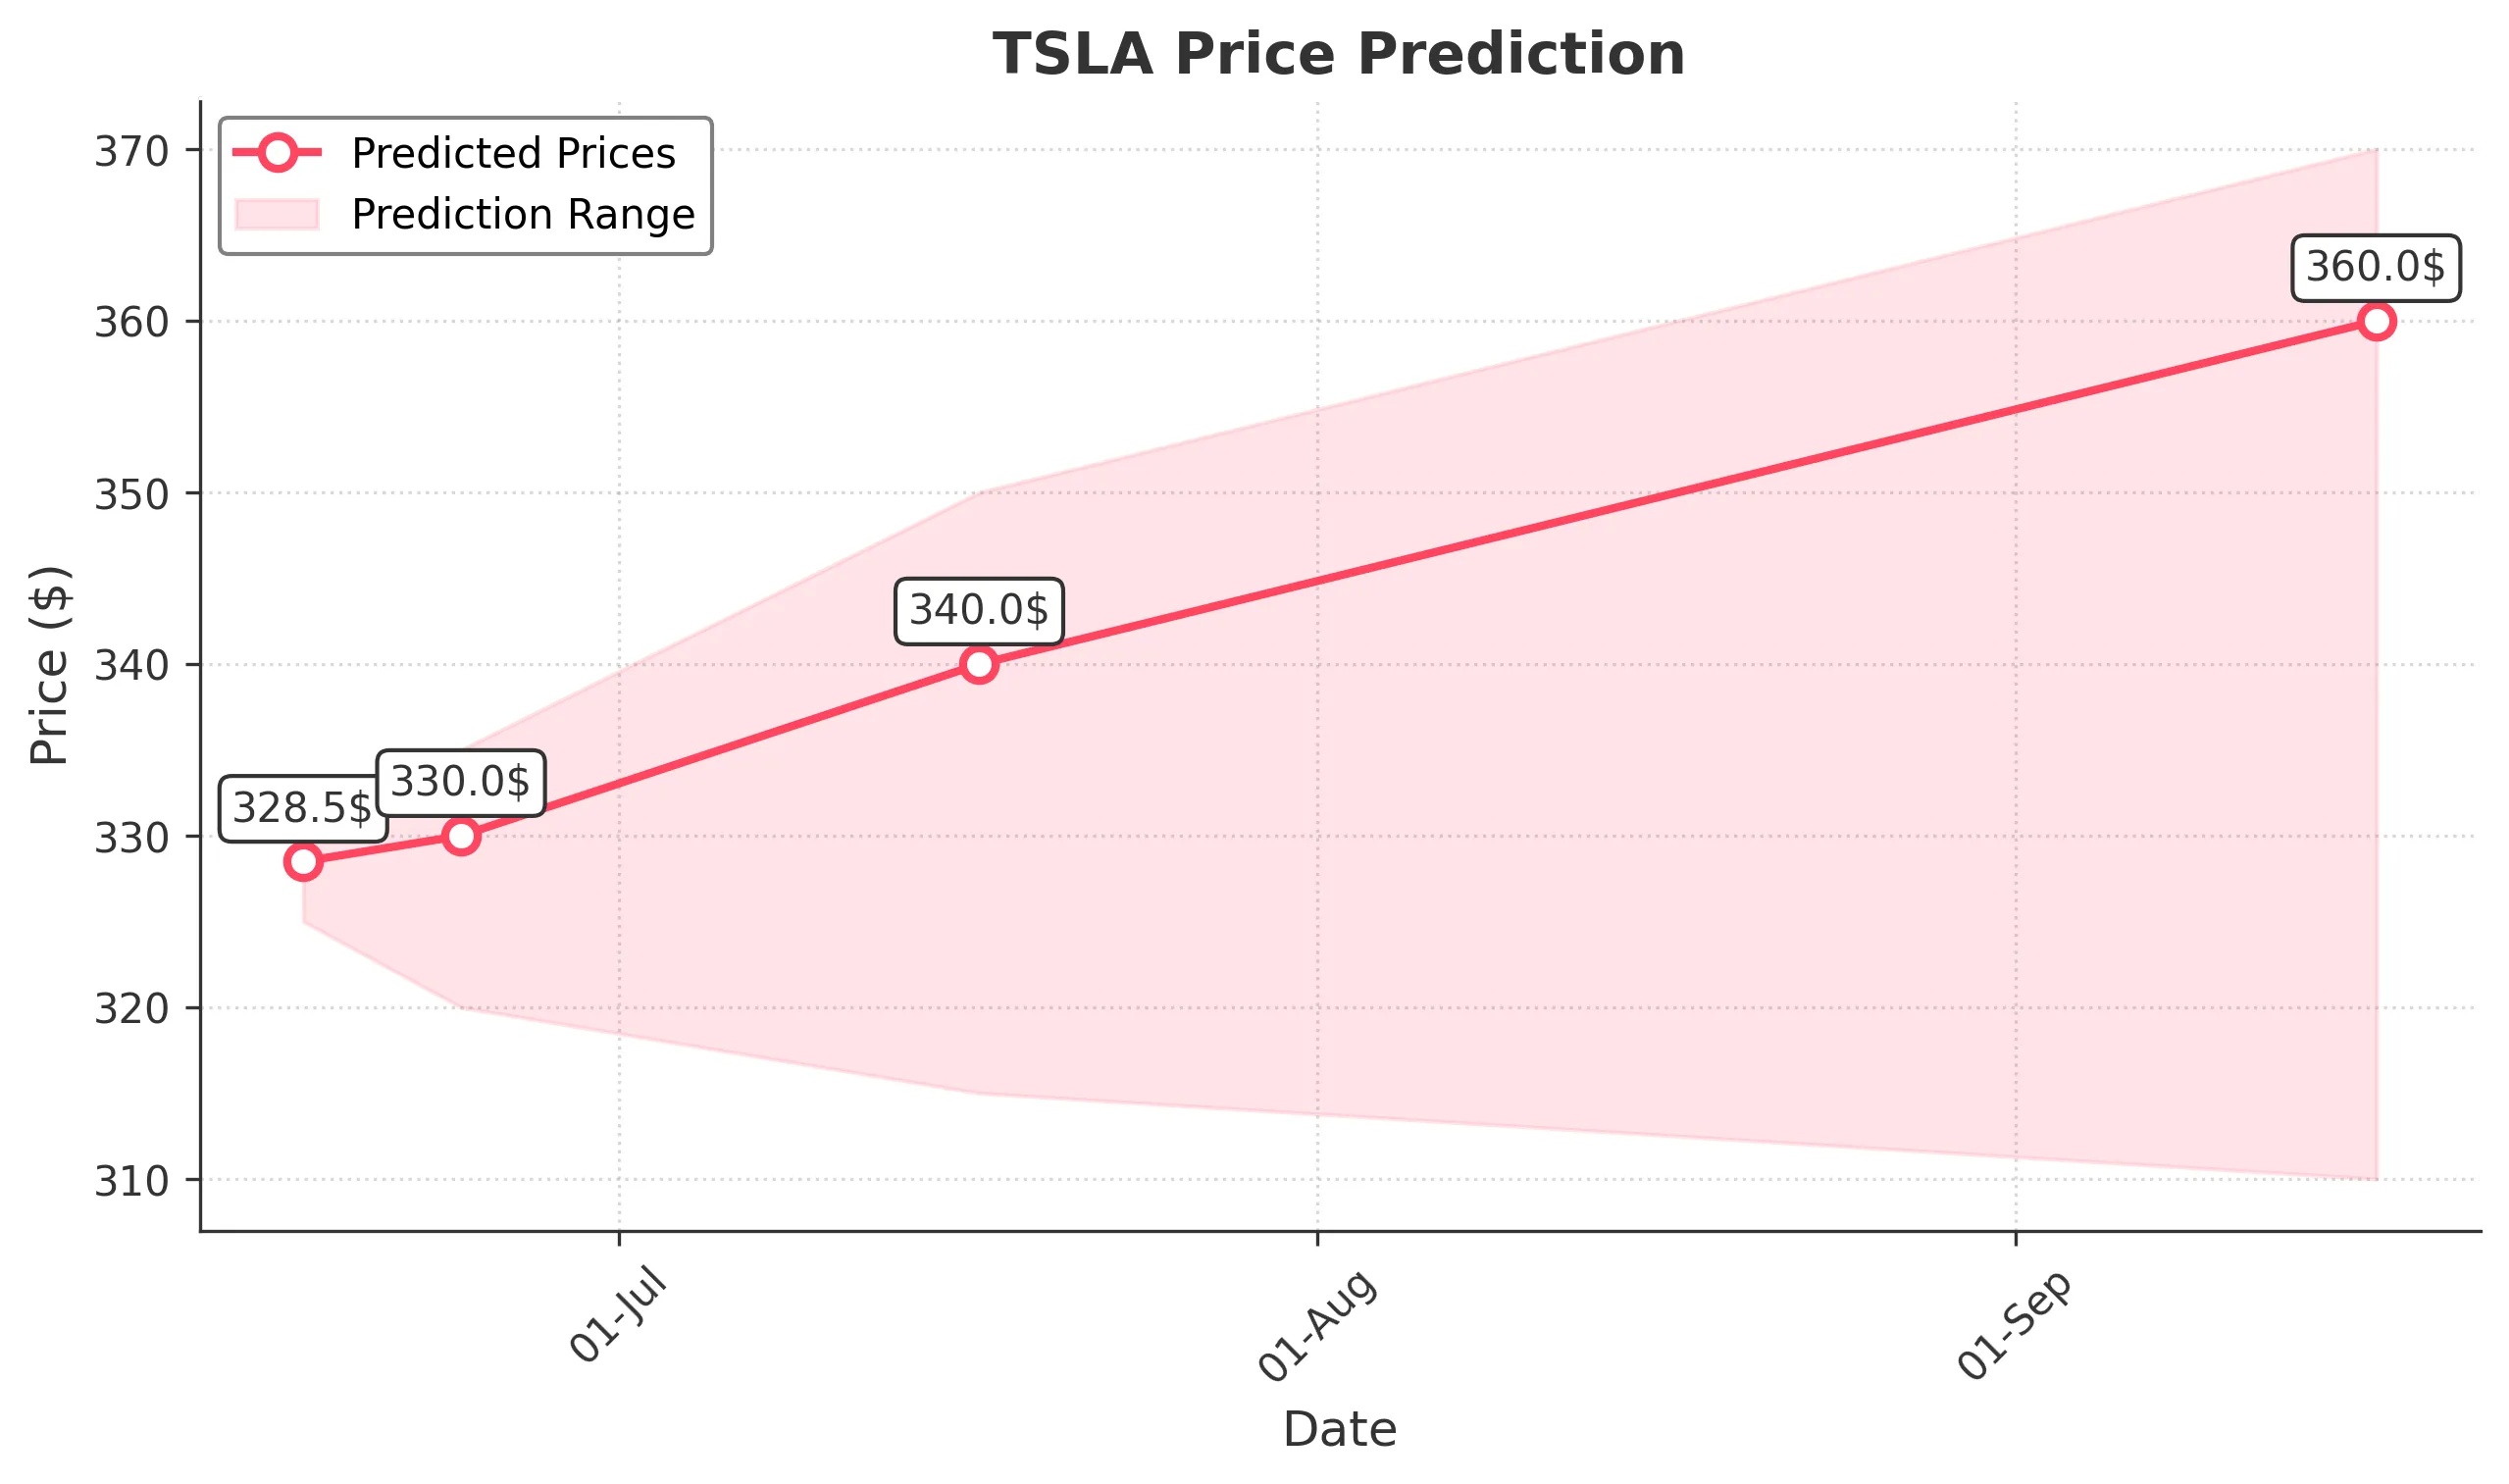
Target: June 17, 2025$328.5
$327.5
$330
$325
Description
The stock shows a slight bullish trend with a recent Doji candlestick indicating indecision. The RSI is around 55, suggesting room for upward movement. However, MACD is flattening, indicating potential resistance ahead.
Analysis
Over the past 3 months, TSLA has shown a bullish trend with significant price increases, peaking at $362.89. Key support is at $284, while resistance is around $350. Volume spikes indicate strong interest, but recent fluctuations suggest caution.
Confidence Level
Potential Risks
Market volatility and external news could impact the price. A sudden downturn in sentiment could lead to a drop.
1 Week Prediction
Target: June 24, 2025$330
$328
$335
$320
Description
The stock is expected to maintain a bullish sentiment, supported by a recent upward trend. However, the MACD indicates potential resistance at $335. Volume analysis shows consistent interest, but market sentiment remains a concern.
Analysis
TSLA has experienced significant volatility, with a recent peak at $362.89. The stock is currently in a consolidation phase, with support at $320 and resistance at $350. Technical indicators suggest a cautious bullish outlook.
Confidence Level
Potential Risks
Potential market corrections or negative news could lead to a price drop. Watch for changes in volume and sentiment.
1 Month Prediction
Target: July 17, 2025$340
$335
$350
$315
Description
Expect a gradual increase in price as the stock stabilizes. The RSI indicates a neutral position, allowing for upward movement. However, the MACD shows potential bearish divergence, which could limit gains.
Analysis
The past three months show a strong bullish trend, but recent price action indicates potential consolidation. Key support is at $315, while resistance is at $350. The stock's volatility remains a concern, with significant fluctuations in volume.
Confidence Level
Potential Risks
Market conditions and external factors could lead to unexpected volatility. Watch for earnings reports or macroeconomic news.
3 Months Prediction
Target: September 17, 2025$360
$350
$370
$310
Description
Long-term outlook remains bullish, driven by strong fundamentals and market sentiment. However, potential resistance at $370 could limit gains. Watch for macroeconomic factors that could impact the tech sector.
Analysis
TSLA has shown a strong upward trend over the last three months, with significant price increases. Key support is at $310, while resistance is at $370. The stock's volatility and external market conditions could influence future performance.
Confidence Level
Potential Risks
Unforeseen market events or changes in investor sentiment could lead to volatility. Earnings reports may also impact stock performance.