TSLA Trading Predictions
1 Day Prediction
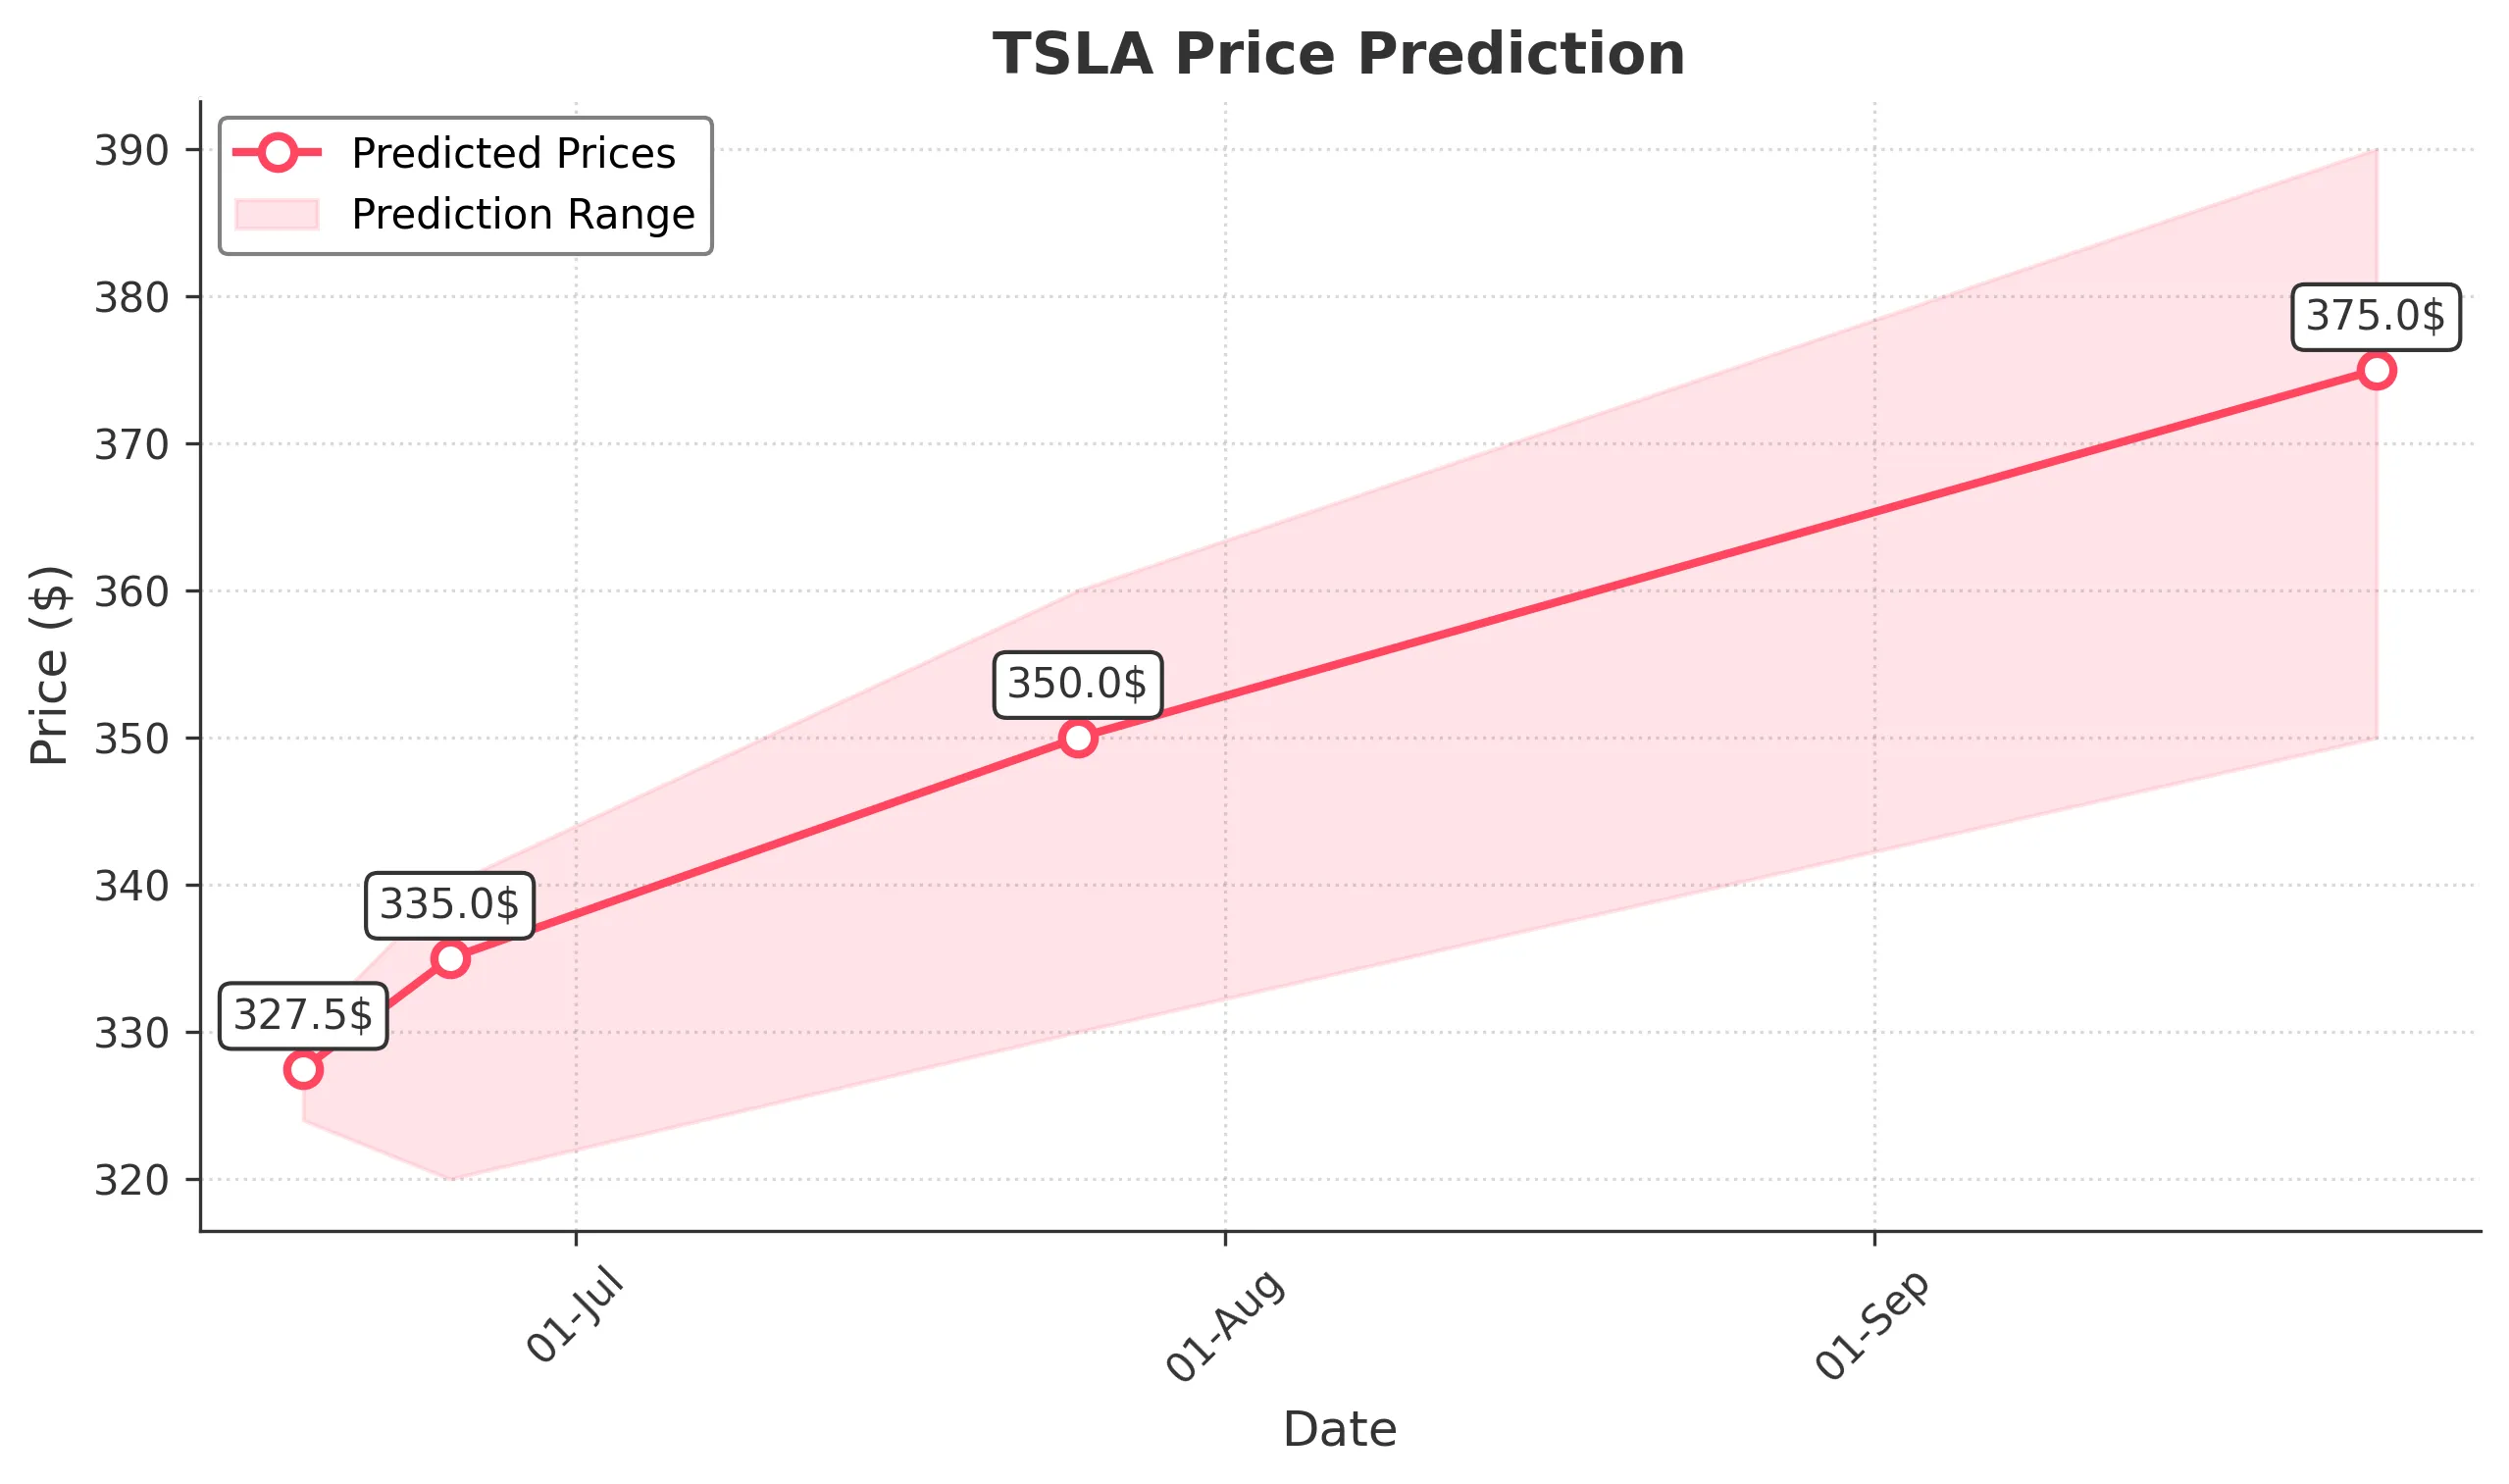
Target: June 18, 2025$327.5
$326.5
$330
$324
Description
The stock shows a slight bullish trend with a recent Doji candlestick indicating indecision. The RSI is neutral, and MACD is showing a potential bullish crossover. However, volatility remains high, suggesting caution.
Analysis
Over the past 3 months, TSLA has shown a bullish trend with significant price increases, peaking at $362.89. Key support is around $284, while resistance is near $362. Technical indicators like MACD and RSI suggest potential upward momentum, but recent volatility raises concerns.
Confidence Level
Potential Risks
Market sentiment could shift quickly due to macroeconomic news or earnings reports, which may impact the prediction.
1 Week Prediction
Target: June 25, 2025$335
$330
$340
$320
Description
The stock is expected to consolidate around current levels with potential upward movement. The Bollinger Bands are tightening, indicating reduced volatility. However, the RSI is approaching overbought territory, suggesting caution.
Analysis
TSLA has experienced significant fluctuations, with a recent peak at $362.89. The stock is currently in a consolidation phase, with support at $320 and resistance at $340. Volume patterns indicate strong interest, but the market's overall sentiment remains mixed.
Confidence Level
Potential Risks
Potential market corrections or negative news could lead to a price drop, impacting the accuracy of this prediction.
1 Month Prediction
Target: July 25, 2025$350
$335
$360
$330
Description
Expect a gradual upward trend as the stock approaches key Fibonacci retracement levels. The MACD indicates bullish momentum, but the RSI suggests potential overbought conditions, warranting caution.
Analysis
The past three months show a strong bullish trend, with TSLA reaching highs of $362.89. Key support is at $320, while resistance is at $360. Technical indicators suggest continued upward momentum, but caution is advised due to potential overbought conditions.
Confidence Level
Potential Risks
Unforeseen macroeconomic events or earnings surprises could lead to volatility and impact the stock's performance.
3 Months Prediction
Target: September 25, 2025$375
$360
$390
$350
Description
Long-term bullish sentiment is supported by strong fundamentals and technical indicators. However, the market may face corrections, and external factors could influence price movements.
Analysis
TSLA has shown a robust performance over the last three months, with significant price increases. The stock is currently in a bullish phase, with key support at $350 and resistance at $390. Technical indicators suggest continued upward momentum, but external factors could introduce volatility.
Confidence Level
Potential Risks
Market volatility and potential economic downturns could impact the stock's trajectory, leading to unexpected price movements.