TSLA Trading Predictions
1 Day Prediction
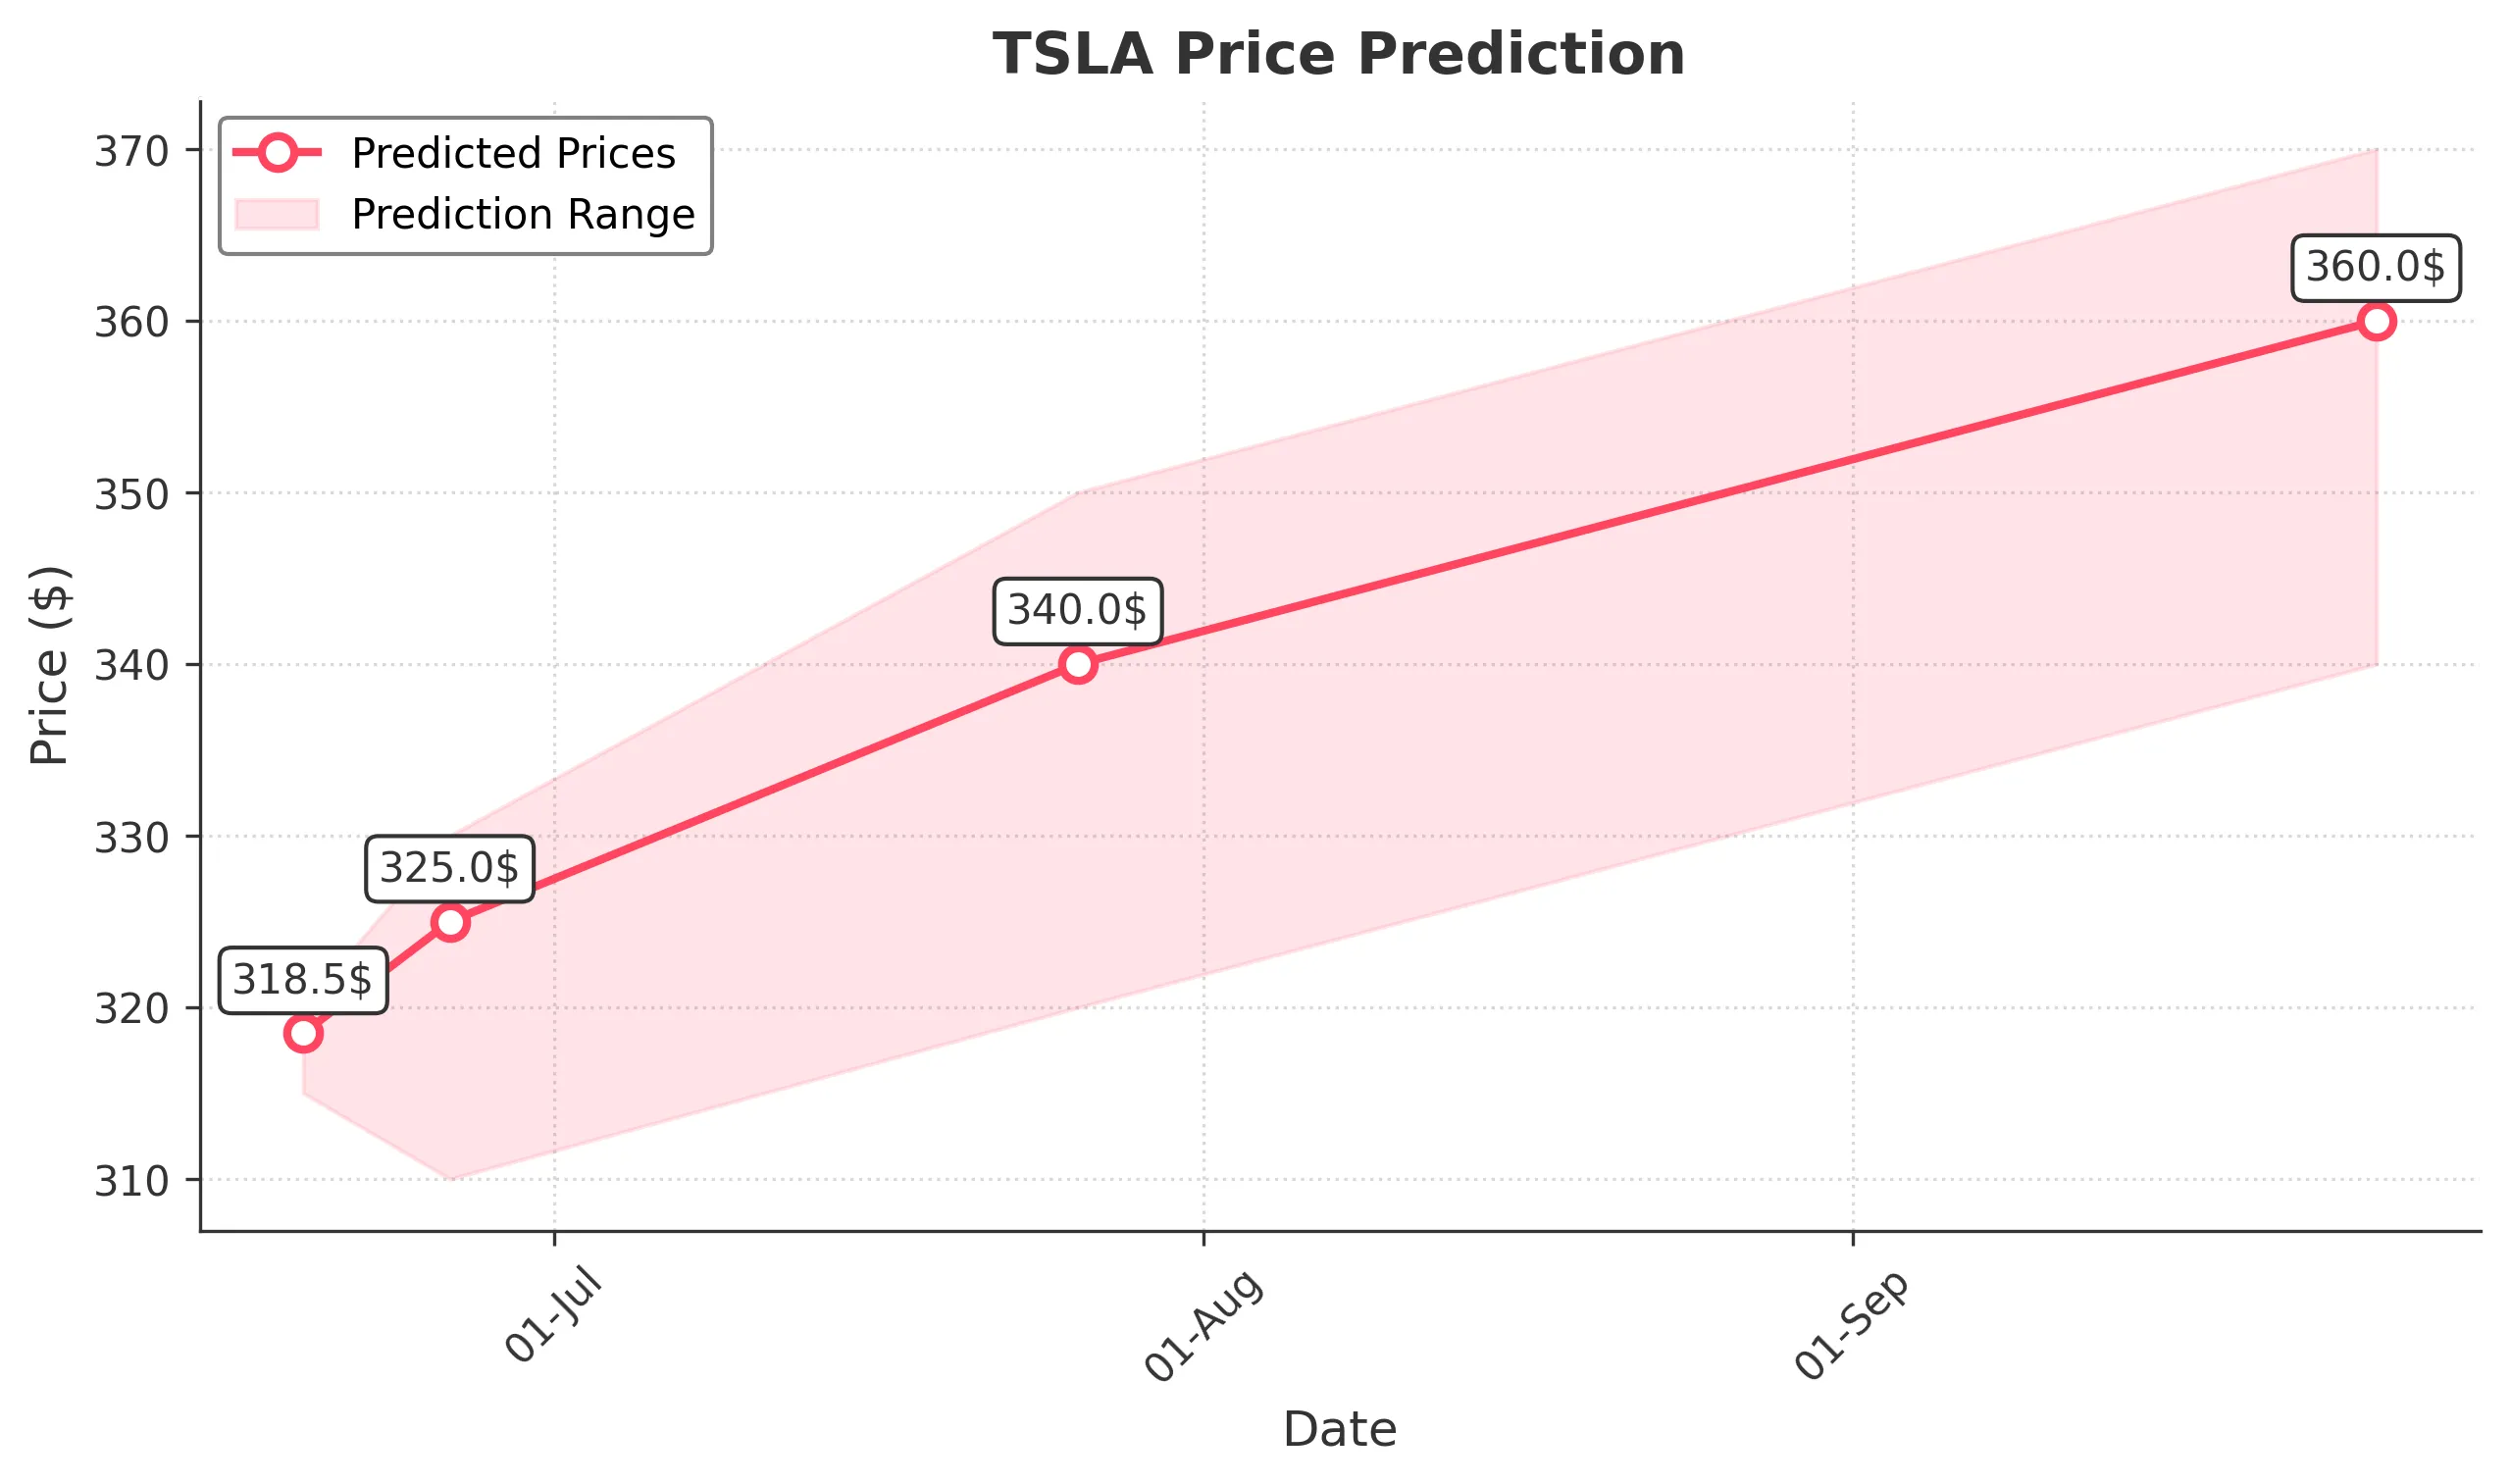
Target: June 19, 2025$318.5
$317
$320
$315
Description
The stock shows a bullish trend with a recent upward movement. The RSI is near 60, indicating strength. A Doji pattern suggests indecision, but overall momentum remains positive. Expect slight volatility due to market sentiment.
Analysis
Over the past 3 months, TSLA has shown a bullish trend with significant price increases. Key support is around $315, while resistance is near $350. The MACD indicates upward momentum, but recent volatility suggests caution.
Confidence Level
Potential Risks
Potential market corrections or external news could impact the price.
1 Week Prediction
Target: June 26, 2025$325
$320
$330
$310
Description
The stock is expected to continue its upward trajectory, supported by strong volume and positive market sentiment. However, the RSI nearing overbought levels may lead to a pullback. Watch for potential resistance at $330.
Analysis
TSLA has experienced significant gains, with a recent peak around $350. The MACD shows bullish momentum, but the RSI indicates potential overbought conditions. Key support is at $310, with resistance at $330.
Confidence Level
Potential Risks
Market volatility and external economic factors could lead to unexpected price movements.
1 Month Prediction
Target: July 26, 2025$340
$335
$350
$320
Description
Expect continued bullish momentum as TSLA approaches key resistance levels. The MACD remains positive, but the RSI indicates potential overbought conditions. Watch for profit-taking that could lead to short-term corrections.
Analysis
The stock has shown a strong upward trend, with significant volume spikes. Key support is at $320, while resistance is at $350. The recent price action suggests a potential consolidation phase before further gains.
Confidence Level
Potential Risks
Market corrections and external economic news could impact the stock's performance.
3 Months Prediction
Target: September 26, 2025$360
$355
$370
$340
Description
Long-term bullish sentiment remains, with potential for further gains as market conditions stabilize. However, watch for volatility and potential corrections as the stock approaches historical highs.
Analysis
TSLA has shown a strong bullish trend over the past months, with key support at $340 and resistance at $370. The MACD indicates continued upward momentum, but the RSI suggests caution due to potential overbought conditions.
Confidence Level
Potential Risks
Unforeseen macroeconomic events or changes in market sentiment could lead to significant price fluctuations.