TSLA Trading Predictions
1 Day Prediction
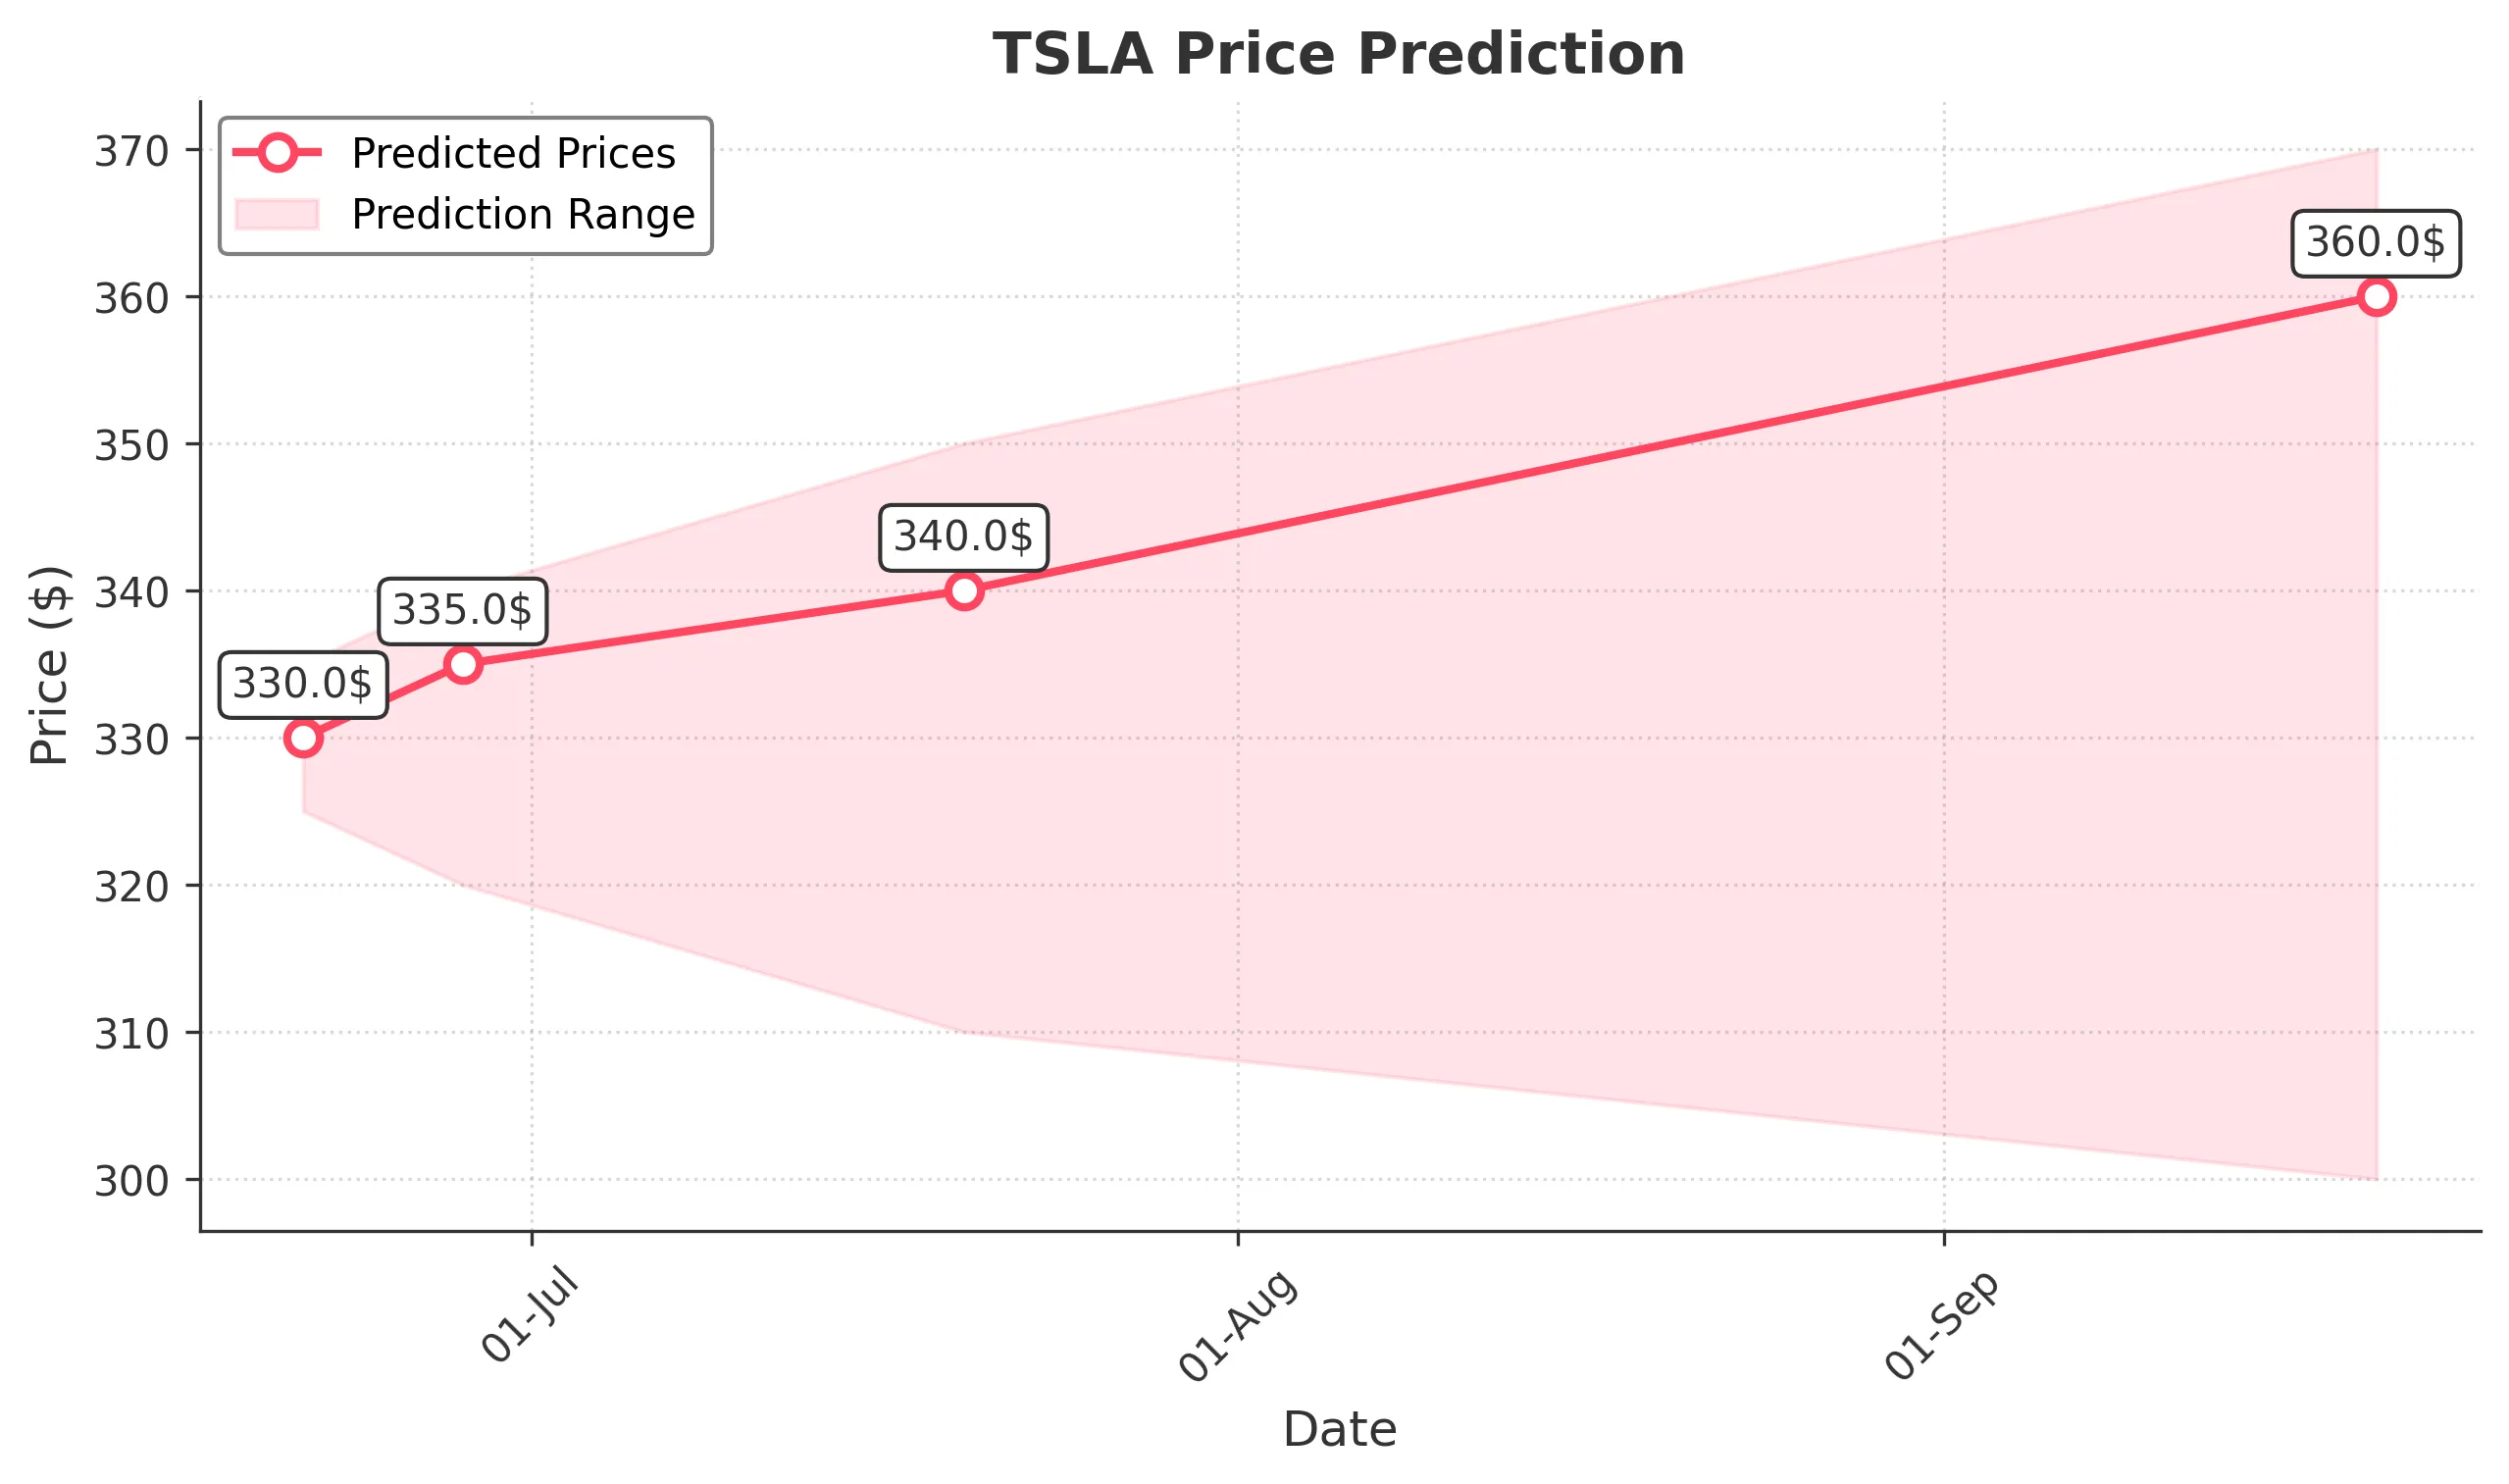
Target: June 21, 2025$330
$328
$335
$325
Description
The stock shows a bullish trend with a recent upward movement. The RSI is approaching overbought levels, indicating potential for a pullback. However, strong support at $325 and positive market sentiment may drive the price higher.
Analysis
Over the past 3 months, TSLA has shown a bullish trend with significant price increases. Key support is at $325, while resistance is around $335. The MACD indicates upward momentum, but the RSI suggests caution as it nears overbought territory.
Confidence Level
Potential Risks
Potential volatility due to market reactions to macroeconomic news could impact the prediction.
1 Week Prediction
Target: June 28, 2025$335
$330
$340
$320
Description
The stock is expected to maintain its upward trajectory, supported by strong buying volume. However, the RSI indicates potential overbought conditions, suggesting a possible pullback. Market sentiment remains positive.
Analysis
TSLA has experienced significant price fluctuations, with a recent bullish trend. The MACD is positive, indicating upward momentum, while the Bollinger Bands suggest potential for a price squeeze. Key support at $320 and resistance at $340.
Confidence Level
Potential Risks
Market volatility and external economic factors could lead to unexpected price movements.
1 Month Prediction
Target: July 20, 2025$340
$335
$350
$310
Description
The stock is likely to continue its upward trend, but with increased volatility. The Fibonacci retracement levels suggest a potential pullback to $310 before resuming upward momentum. Market sentiment remains cautiously optimistic.
Analysis
In the last three months, TSLA has shown strong bullish momentum, with significant price increases. The RSI is nearing overbought levels, and the MACD supports continued upward movement. Key support at $310 and resistance at $350.
Confidence Level
Potential Risks
Economic indicators and potential market corrections could impact the stock's performance.
3 Months Prediction
Target: September 20, 2025$360
$340
$370
$300
Description
The stock may reach new highs, but potential market corrections could lead to volatility. The overall trend remains bullish, supported by strong fundamentals and market sentiment, but caution is advised due to overbought conditions.
Analysis
TSLA has shown a strong bullish trend over the past three months, with significant price increases. However, the RSI indicates overbought conditions, and the MACD shows signs of potential reversal. Key support at $300 and resistance at $370.
Confidence Level
Potential Risks
Unforeseen macroeconomic events and market corrections could significantly affect the stock's trajectory.