TSLA Trading Predictions
1 Day Prediction
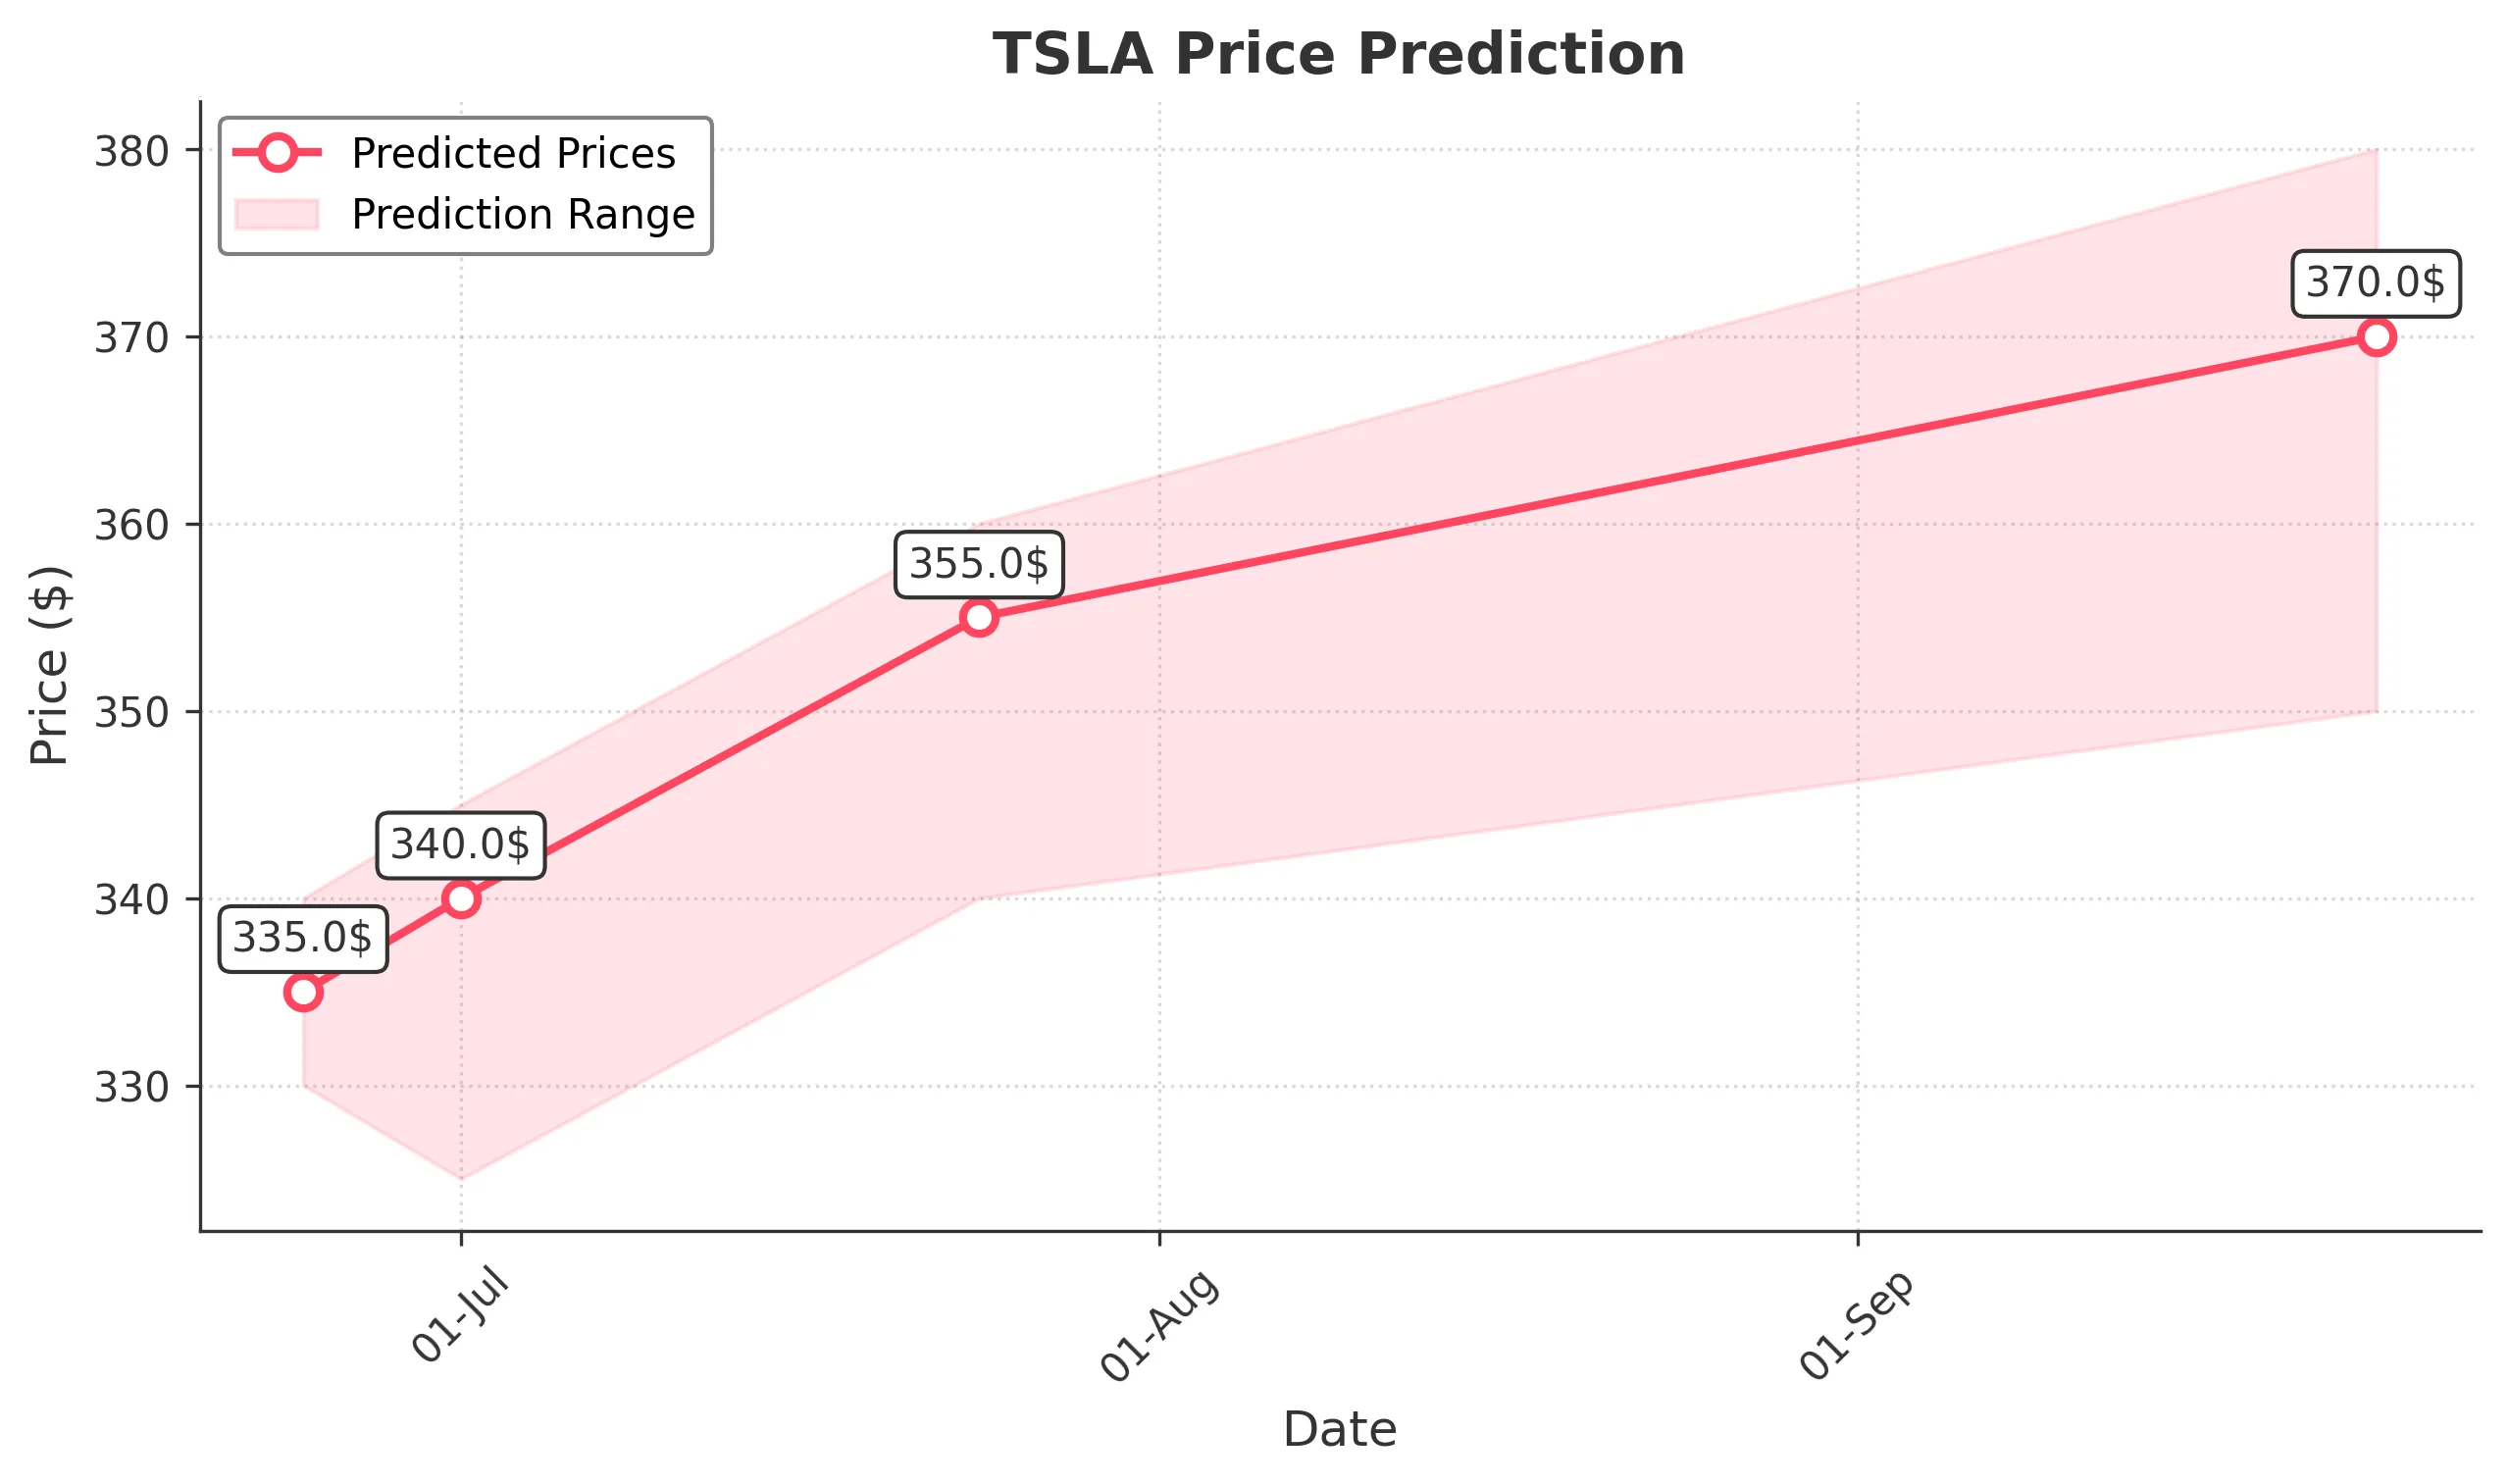
Target: June 24, 2025$335
$334
$340
$330
Description
The stock shows bullish momentum with a recent upward trend. The RSI is approaching overbought levels, indicating potential for a pullback. However, strong volume and positive market sentiment suggest a close around 335.
Analysis
TSLA has shown a bullish trend over the past three months, with significant support at 320 and resistance around 350. Recent volume spikes indicate strong buying interest. However, the RSI nearing overbought levels suggests caution.
Confidence Level
Potential Risks
Potential for a pullback due to overbought RSI and market volatility.
1 Week Prediction
Target: July 1, 2025$340
$335
$345
$325
Description
The upward trend is expected to continue, but with potential volatility. The MACD shows bullish momentum, while the Bollinger Bands indicate a squeeze, suggesting a breakout. Expect a close around 340.
Analysis
The stock has been trending upward, with key support at 320 and resistance at 350. The MACD is bullish, but the RSI indicates potential overbought conditions. Volume patterns suggest strong interest, but external factors could introduce volatility.
Confidence Level
Potential Risks
Market sentiment could shift due to macroeconomic factors or earnings reports.
1 Month Prediction
Target: July 24, 2025$355
$350
$360
$340
Description
Expect continued bullish momentum as the stock approaches key resistance levels. The Fibonacci retracement levels suggest potential for upward movement, but watch for signs of exhaustion.
Analysis
TSLA has maintained a bullish trend, with significant support at 320 and resistance at 360. The MACD remains positive, but the RSI indicates potential overbought conditions. Volume trends are strong, but external factors could introduce risk.
Confidence Level
Potential Risks
Market corrections or negative news could impact the stock's performance.
3 Months Prediction
Target: September 24, 2025$370
$360
$380
$350
Description
Long-term bullish outlook as the stock breaks through resistance levels. However, macroeconomic factors and earnings reports could introduce volatility. Watch for potential corrections.
Analysis
The stock has shown a strong upward trend, with key support at 340 and resistance at 380. The MACD is bullish, but the RSI indicates potential overbought conditions. Volume patterns suggest strong interest, but external factors could introduce volatility.
Confidence Level
Potential Risks
Unforeseen market events or economic downturns could lead to price corrections.