TSLA Trading Predictions
1 Day Prediction
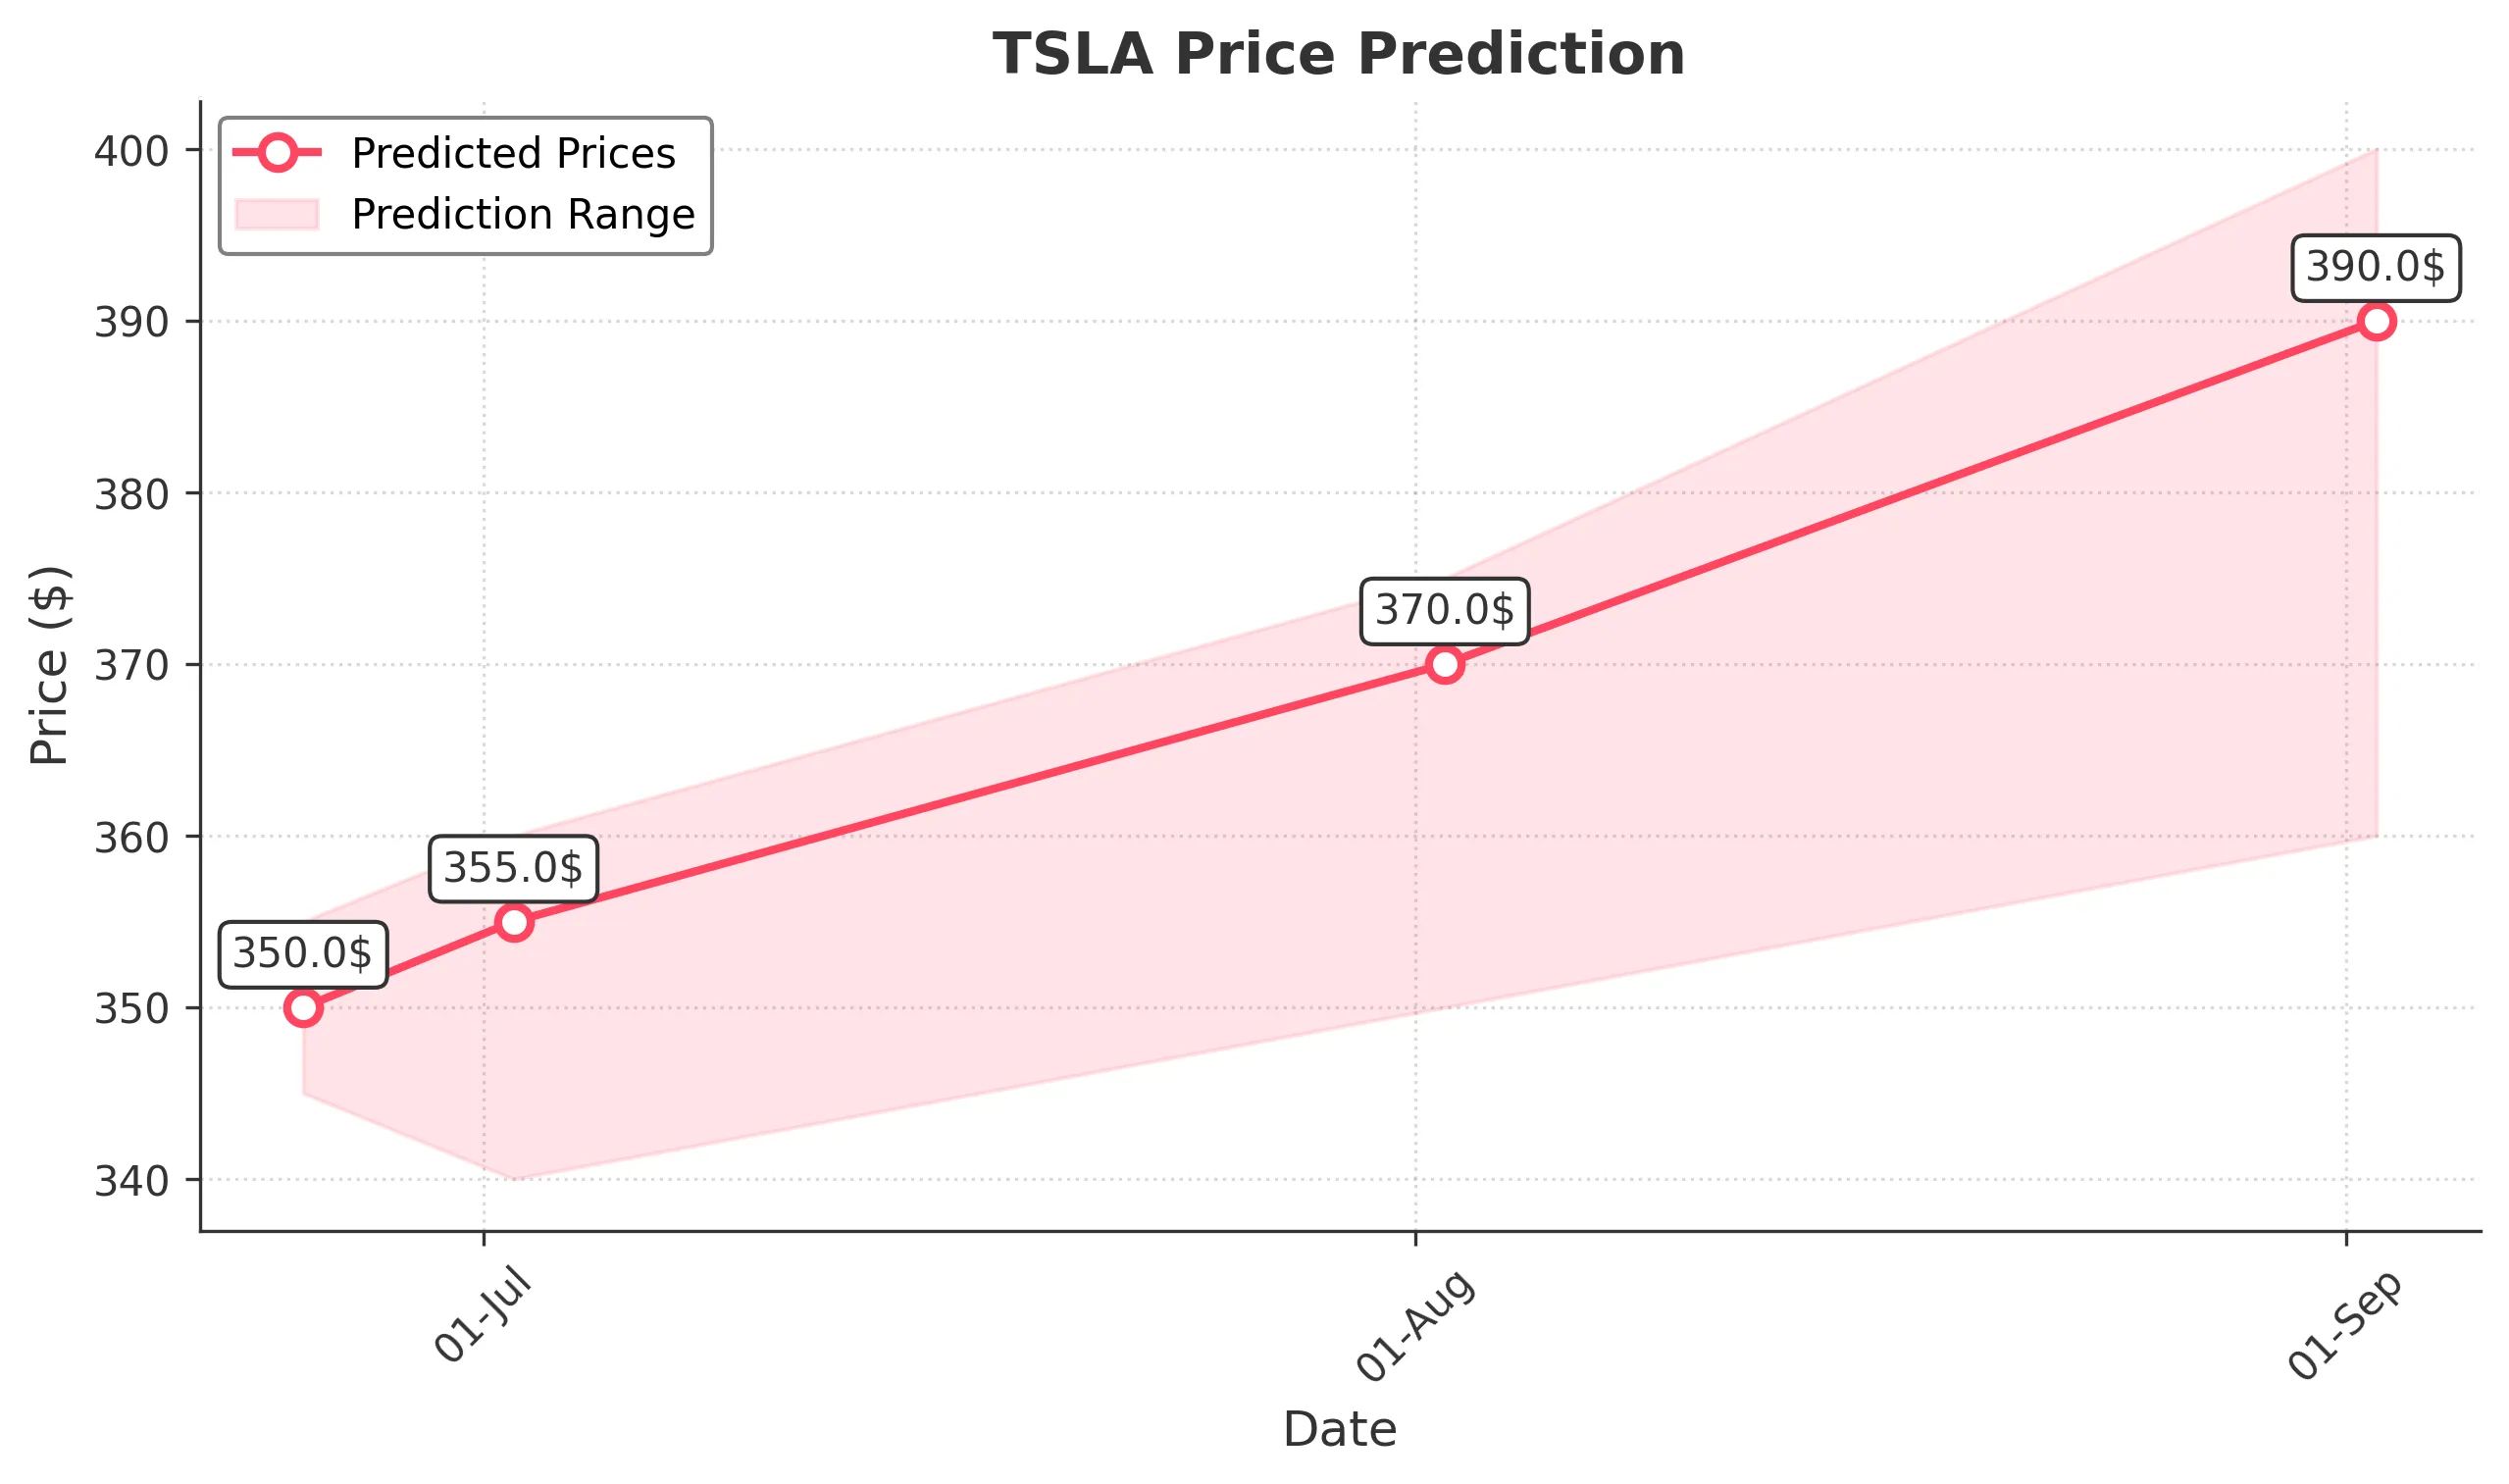
Target: June 25, 2025$350
$348
$355
$345
Description
The stock shows bullish momentum with a recent upward trend. The RSI is approaching overbought levels, indicating potential for a pullback. However, strong volume and positive market sentiment suggest a close around $350.
Analysis
TSLA has shown a bullish trend over the past three months, with significant support at $320 and resistance around $360. The recent price action indicates strong buying interest, but the RSI nearing overbought levels raises concerns about a possible correction.
Confidence Level
Potential Risks
Potential for a pullback due to overbought RSI and market volatility.
1 Week Prediction
Target: July 2, 2025$355
$352
$360
$340
Description
The upward trend is expected to continue, supported by strong volume and bullish candlestick patterns. However, the RSI indicates potential overbought conditions, which could lead to a short-term pullback.
Analysis
The stock has been trending upward, with key support at $340 and resistance at $360. The MACD shows bullish momentum, but the high volume indicates potential profit-taking. Overall, the outlook remains positive, but caution is warranted.
Confidence Level
Potential Risks
Market sentiment could shift due to macroeconomic news or earnings reports, impacting the stock's performance.
1 Month Prediction
Target: August 2, 2025$370
$365
$375
$350
Description
Expect continued bullish momentum as the stock approaches key Fibonacci retracement levels. However, the RSI suggests caution as it nears overbought territory, indicating a possible correction.
Analysis
TSLA has shown strong performance with a bullish trend. Key support is at $350, while resistance is at $375. The MACD and moving averages indicate upward momentum, but the high RSI suggests a potential pullback could occur.
Confidence Level
Potential Risks
Unforeseen macroeconomic events or earnings surprises could lead to volatility and impact the stock's trajectory.
3 Months Prediction
Target: September 2, 2025$390
$375
$400
$360
Description
Long-term bullish outlook supported by strong fundamentals and market sentiment. However, potential resistance at $400 may lead to profit-taking and increased volatility.
Analysis
Over the past three months, TSLA has shown a strong upward trend, with key support at $360 and resistance at $400. The stock's performance is influenced by macroeconomic factors and market sentiment, which could lead to fluctuations in price.
Confidence Level
Potential Risks
Market conditions, economic indicators, and competitive pressures could impact the stock's performance significantly.