TSLA Trading Predictions
1 Day Prediction
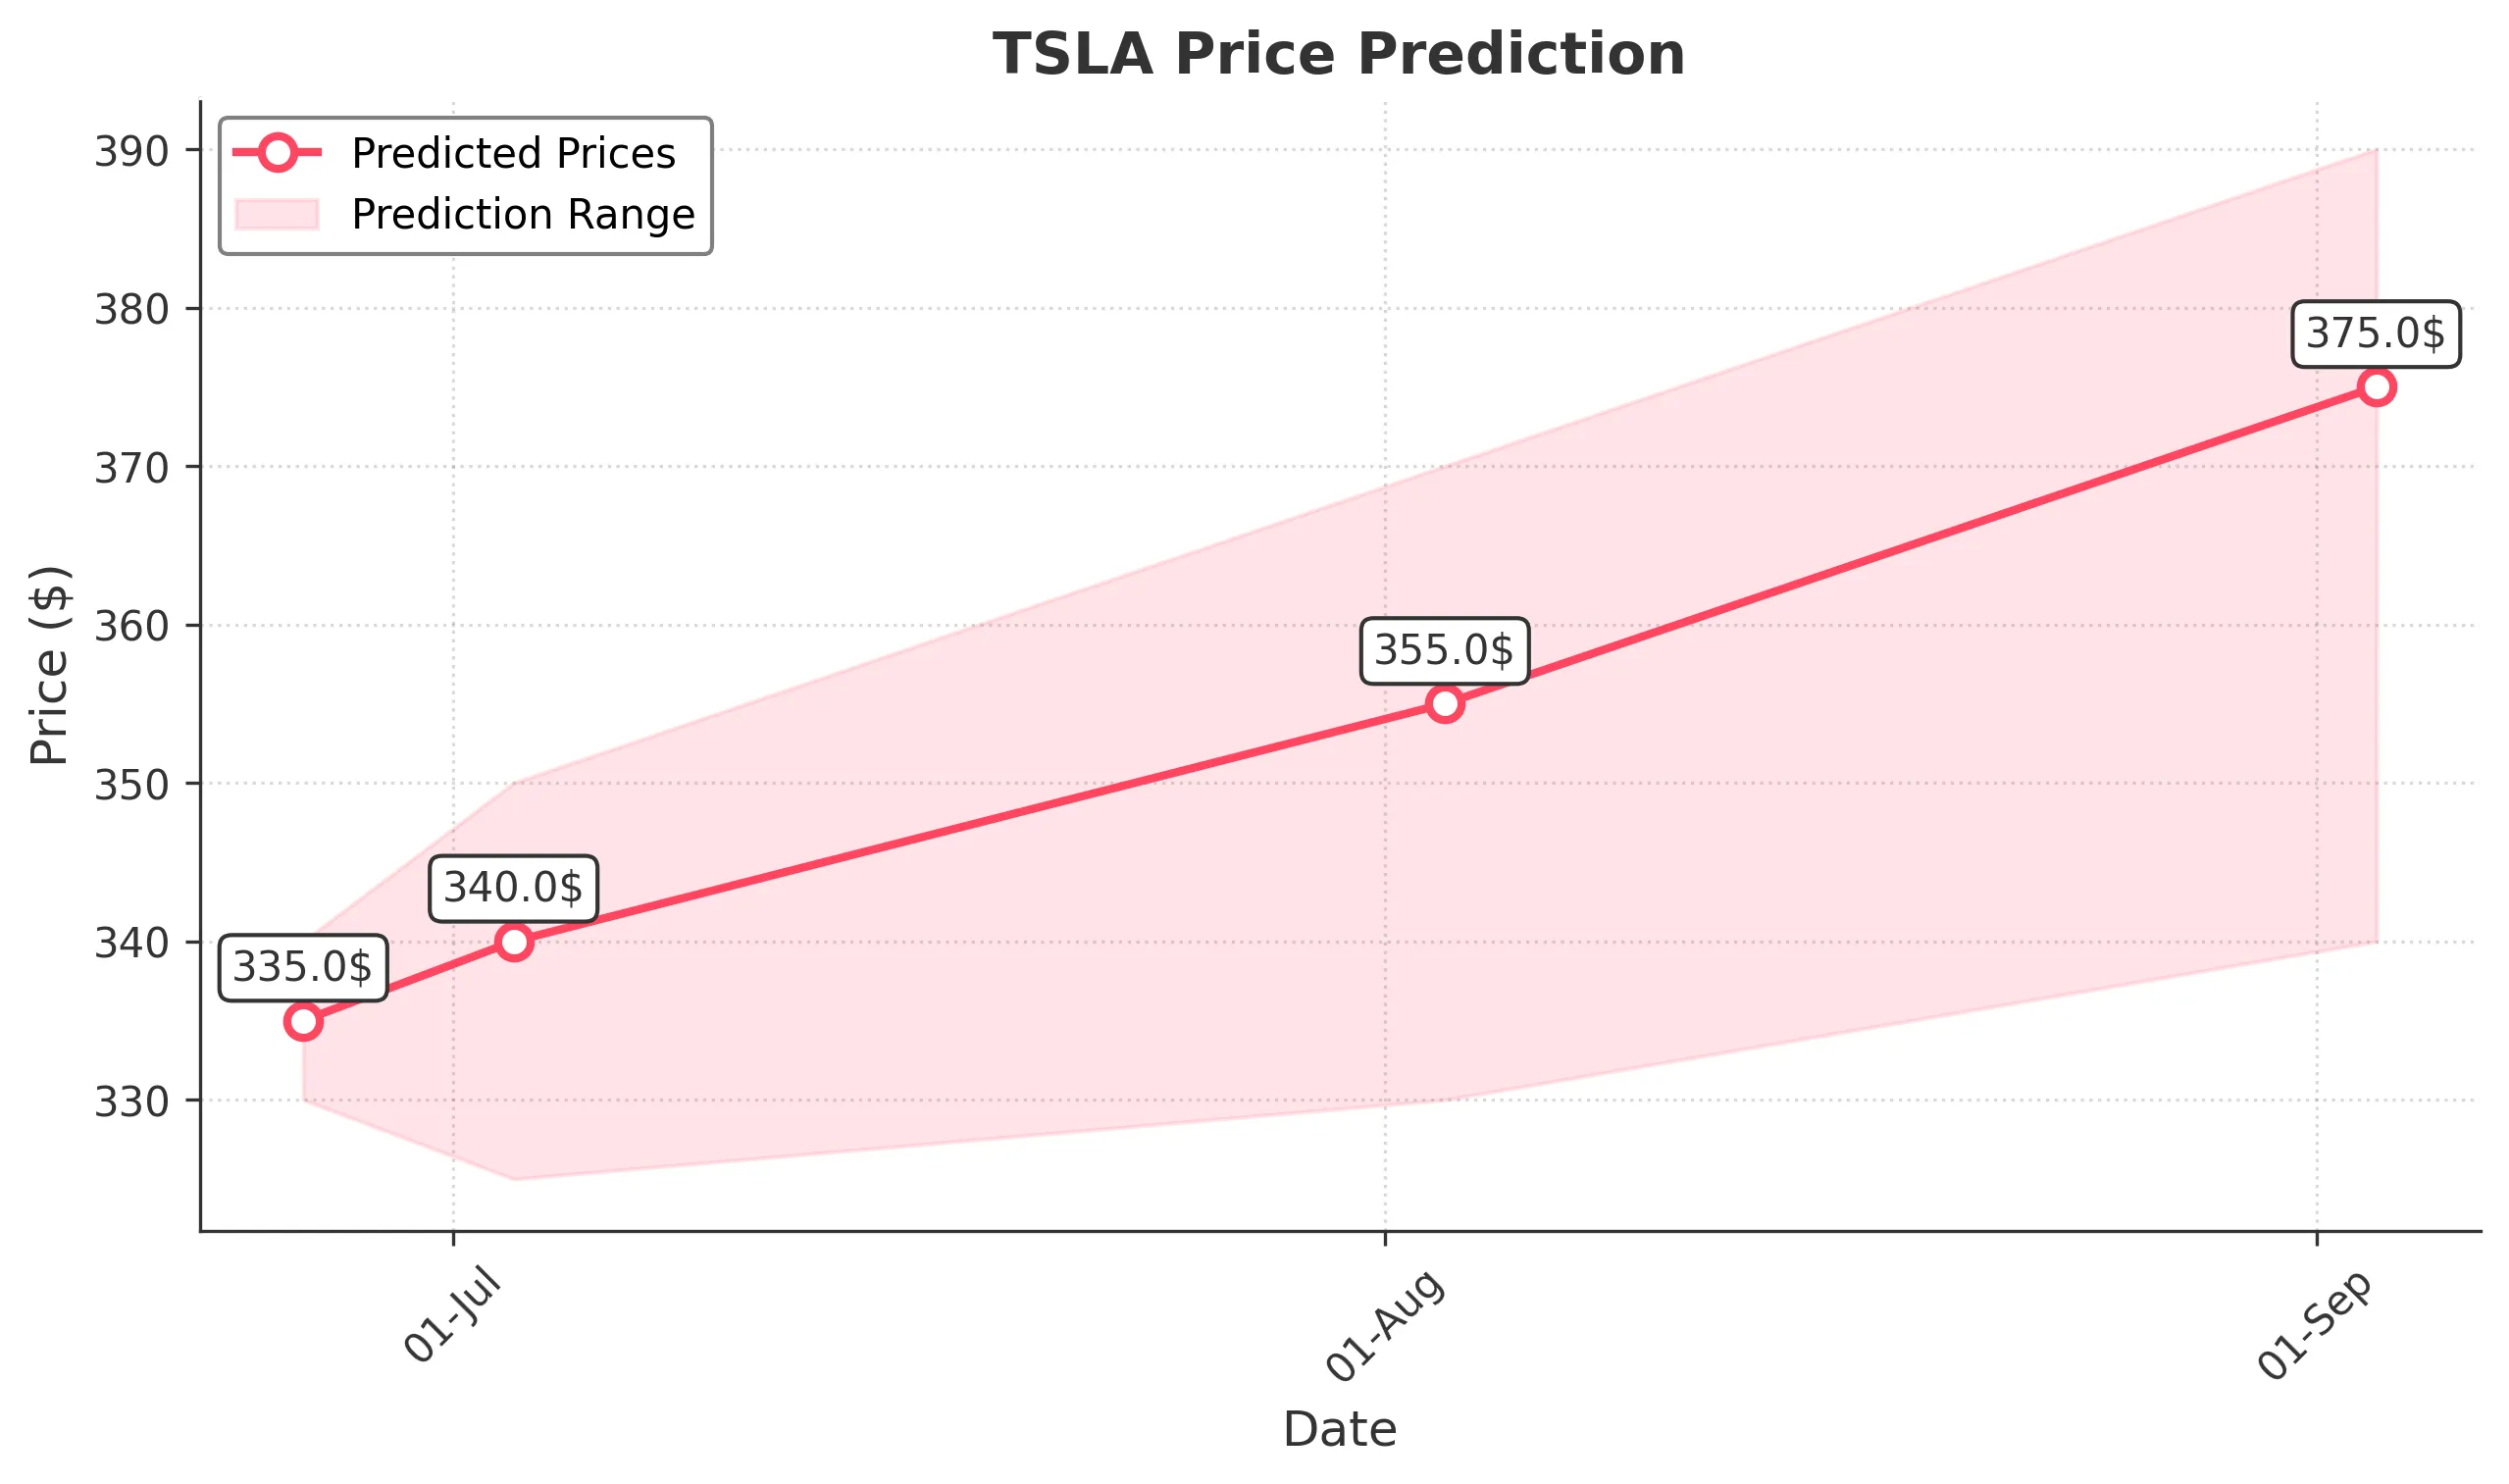
Target: June 26, 2025$335
$335.5
$340
$330
Description
The stock shows a slight bullish trend with a recent Doji pattern indicating indecision. The RSI is neutral, and MACD is close to crossing above the signal line, suggesting potential upward momentum. However, volatility remains a concern.
Analysis
Over the past 3 months, TSLA has shown a bullish trend with significant price fluctuations. Key support is around $320, while resistance is near $350. The recent increase in volume indicates strong interest, but volatility remains high, suggesting caution.
Confidence Level
Potential Risks
Market sentiment could shift due to macroeconomic news or earnings reports, which may impact the stock's performance.
1 Week Prediction
Target: July 3, 2025$340
$335
$350
$325
Description
The stock is expected to continue its upward trend, supported by a bullish MACD crossover and a recent bullish engulfing pattern. However, the RSI is approaching overbought territory, indicating potential pullbacks.
Analysis
TSLA has experienced a bullish phase with increasing volume and positive sentiment. Key resistance at $350 may pose challenges, while support at $320 remains strong. The stock's volatility suggests that traders should be cautious.
Confidence Level
Potential Risks
Potential market corrections or negative news could lead to a sudden drop in price, affecting the prediction.
1 Month Prediction
Target: August 3, 2025$355
$340
$370
$330
Description
The stock is likely to reach higher levels as bullish momentum continues. The Fibonacci retracement levels suggest a target near $355, but overbought conditions may lead to corrections.
Analysis
In the last three months, TSLA has shown strong bullish momentum with significant price increases. Key support at $320 and resistance at $370 are critical levels to watch. The stock's volatility and market sentiment remain key factors.
Confidence Level
Potential Risks
Unforeseen market events or earnings surprises could lead to volatility and impact the price trajectory.
3 Months Prediction
Target: September 3, 2025$375
$360
$390
$340
Description
The stock is expected to continue its upward trajectory, driven by strong fundamentals and market sentiment. However, potential resistance at $390 may lead to profit-taking.
Analysis
TSLA has shown a strong bullish trend over the past three months, with significant price increases and high trading volumes. Key resistance at $390 and support at $340 are critical levels. The stock's volatility and external factors should be monitored closely.
Confidence Level
Potential Risks
Market volatility and external economic factors could lead to unexpected price movements, impacting the prediction.