TSLA Trading Predictions
1 Day Prediction
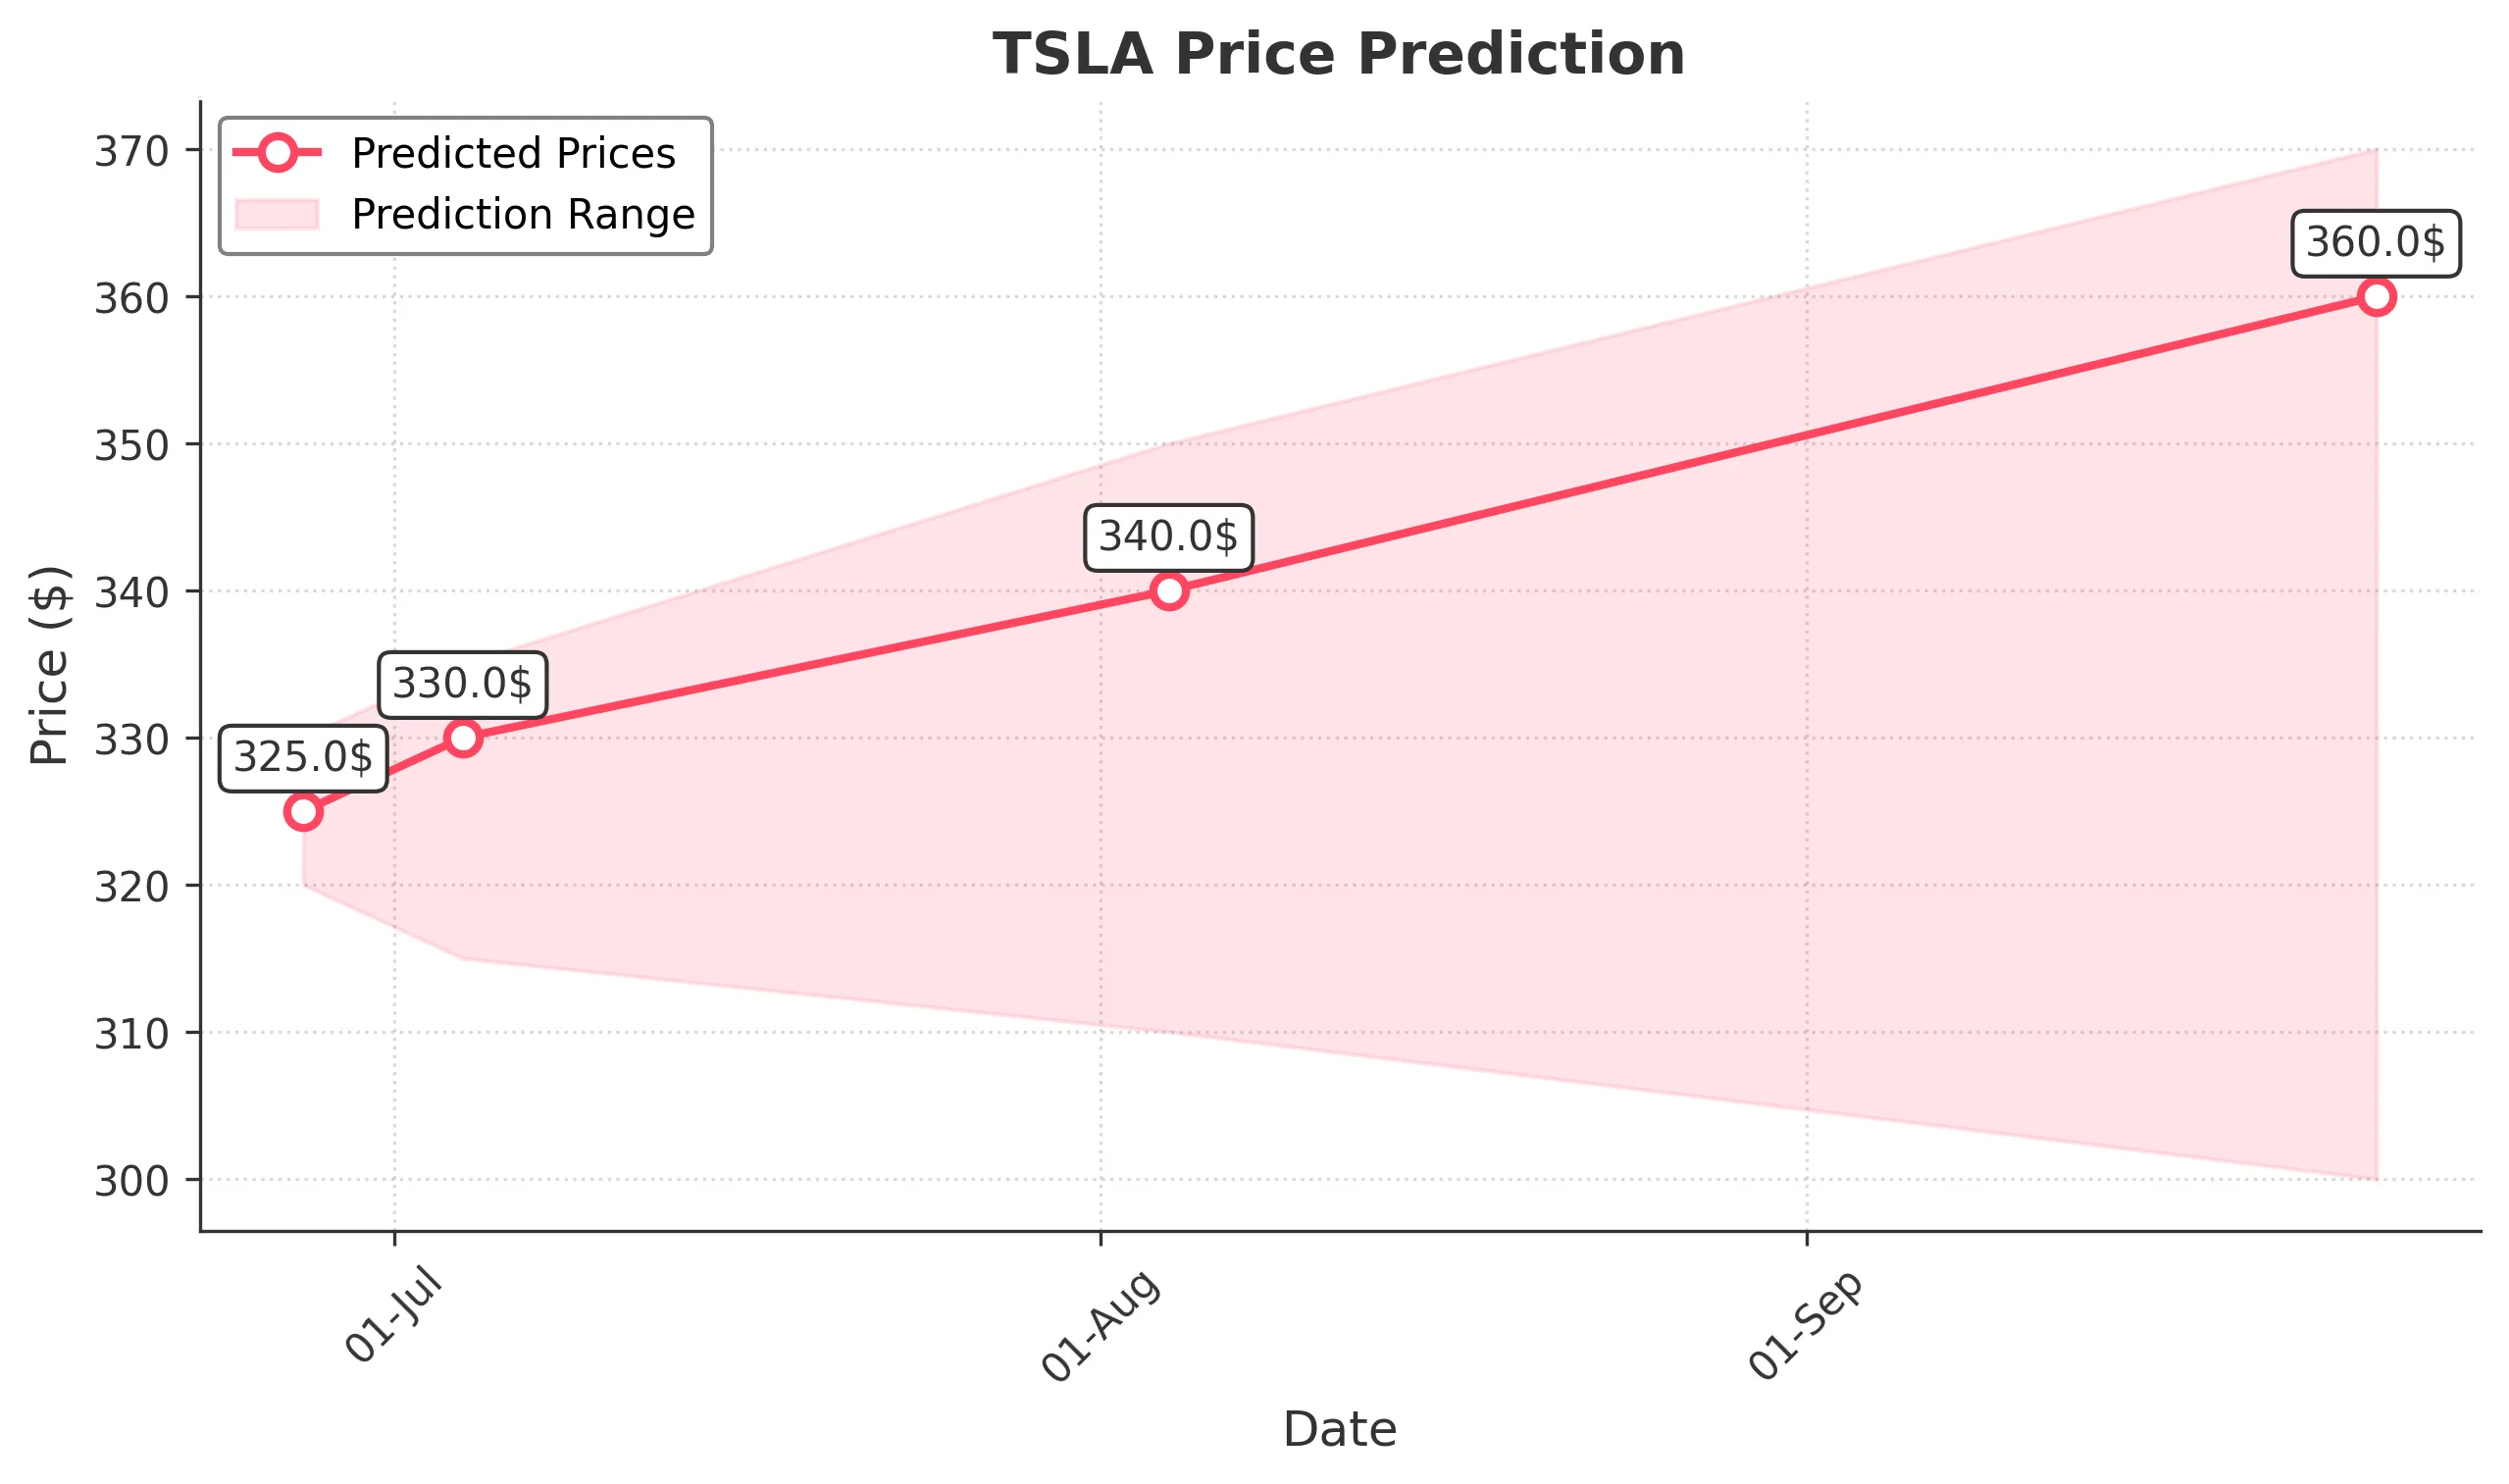
Target: June 27, 2025$325
$324
$330
$320
Description
The stock shows a slight bullish trend with a potential close around 325. The RSI is neutral, and MACD indicates a potential upward momentum. However, recent volatility suggests caution.
Analysis
Over the past 3 months, TSLA has shown a mix of bullish and bearish trends, with significant support at 320 and resistance around 350. Recent volume spikes indicate increased interest, but volatility remains high.
Confidence Level
Potential Risks
Market sentiment could shift due to external news or earnings reports, impacting the prediction.
1 Week Prediction
Target: July 4, 2025$330
$325
$335
$315
Description
A bullish outlook for the week ahead, with potential for a close at 330. The MACD is showing a bullish crossover, and the stock is testing resistance levels. Watch for volume trends.
Analysis
TSLA has been fluctuating between 320 and 350, with recent bullish momentum. The RSI is approaching overbought territory, indicating a possible pullback. Key support at 320 remains critical.
Confidence Level
Potential Risks
Potential market corrections or negative news could reverse the trend.
1 Month Prediction
Target: August 4, 2025$340
$330
$350
$310
Description
Expect a gradual increase to 340 by month-end, supported by positive market sentiment and technical indicators. However, watch for resistance at 350.
Analysis
The stock has shown resilience with a bullish trend, but the RSI indicates potential overbought conditions. Key resistance at 350 could limit upside, while support at 310 is crucial.
Confidence Level
Potential Risks
Economic factors or earnings reports could lead to unexpected volatility.
3 Months Prediction
Target: September 26, 2025$360
$340
$370
$300
Description
Long-term outlook suggests a rise to 360, driven by strong fundamentals and market recovery. However, external economic factors could pose risks.
Analysis
TSLA has experienced significant volatility, with a general upward trend. Key support at 300 and resistance at 370 are critical levels to monitor. The market's overall sentiment remains cautiously optimistic.
Confidence Level
Potential Risks
Unforeseen macroeconomic events or shifts in market sentiment could impact the forecast.