TSLA Trading Predictions
1 Day Prediction
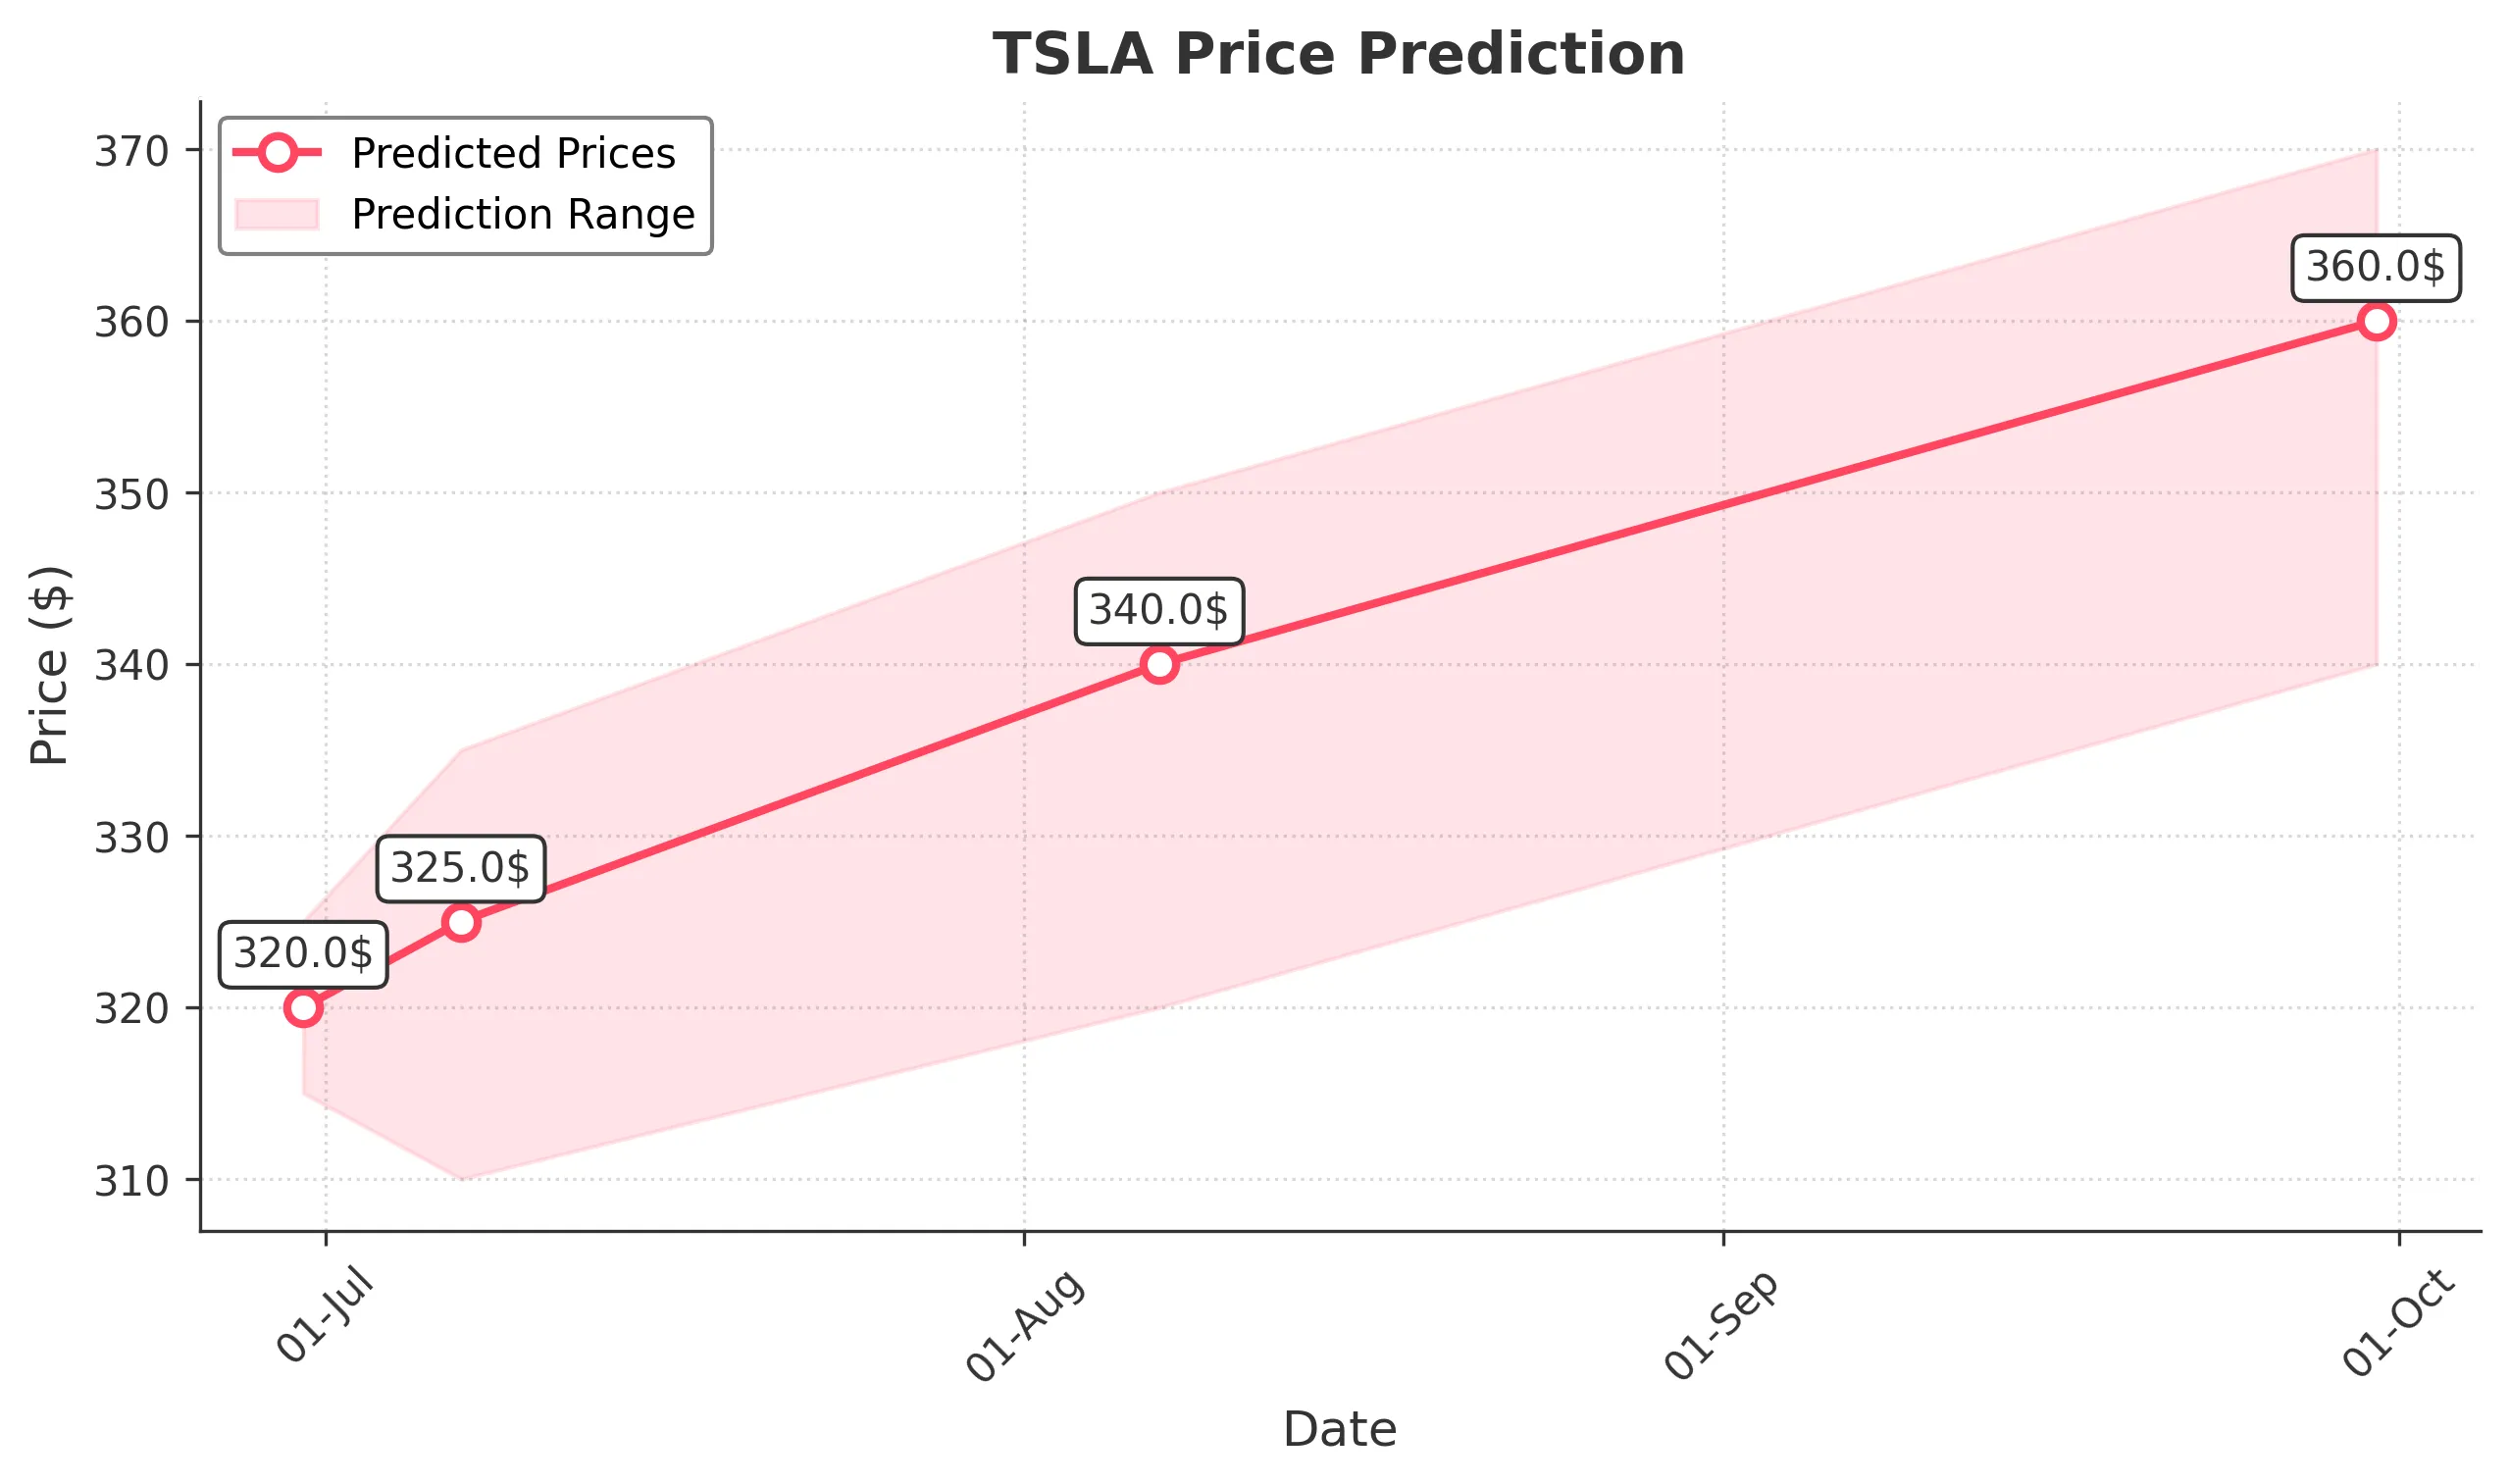
Target: June 30, 2025$320
$318
$325
$315
Description
The stock shows a slight bullish trend with a recent Doji pattern indicating indecision. RSI is neutral, and MACD is close to crossing above the signal line. Expect a minor rebound as market sentiment stabilizes.
Analysis
Over the past 3 months, TSLA has shown a bearish trend with significant fluctuations. Key support at $320 and resistance at $350. Volume spikes indicate potential reversals. Recent candlestick patterns suggest indecision, while macroeconomic factors remain uncertain.
Confidence Level
Potential Risks
Market volatility and external news could impact the price significantly.
1 Week Prediction
Target: July 7, 2025$325
$320
$335
$310
Description
A potential upward movement is anticipated as the stock approaches key Fibonacci retracement levels. The MACD shows bullish momentum, and the RSI is recovering from oversold conditions.
Analysis
The stock has been in a corrective phase, with recent support at $310. Technical indicators suggest a possible reversal. Volume analysis shows increased interest, but external factors could still sway the market direction.
Confidence Level
Potential Risks
Unforeseen market events or earnings reports could lead to volatility.
1 Month Prediction
Target: August 7, 2025$340
$335
$350
$320
Description
Expect a gradual recovery as bullish sentiment builds. The stock is likely to test resistance at $350, supported by positive market sentiment and improving technical indicators.
Analysis
TSLA has shown resilience despite recent downturns. Key resistance at $350 and support at $320. The MACD is bullish, and the RSI indicates potential upward momentum. However, external factors remain a concern.
Confidence Level
Potential Risks
Economic data releases and geopolitical tensions could impact market stability.
3 Months Prediction
Target: September 30, 2025$360
$355
$370
$340
Description
Long-term bullish outlook as the stock is expected to break through resistance levels. Positive earnings reports and market sentiment could drive prices higher.
Analysis
The stock has been volatile, with a recent bearish trend. Key support at $340 and resistance at $370. Technical indicators suggest potential for recovery, but macroeconomic factors and market sentiment could influence future performance.
Confidence Level
Potential Risks
Market corrections and economic downturns could reverse the trend.