TSLA Trading Predictions
1 Day Prediction
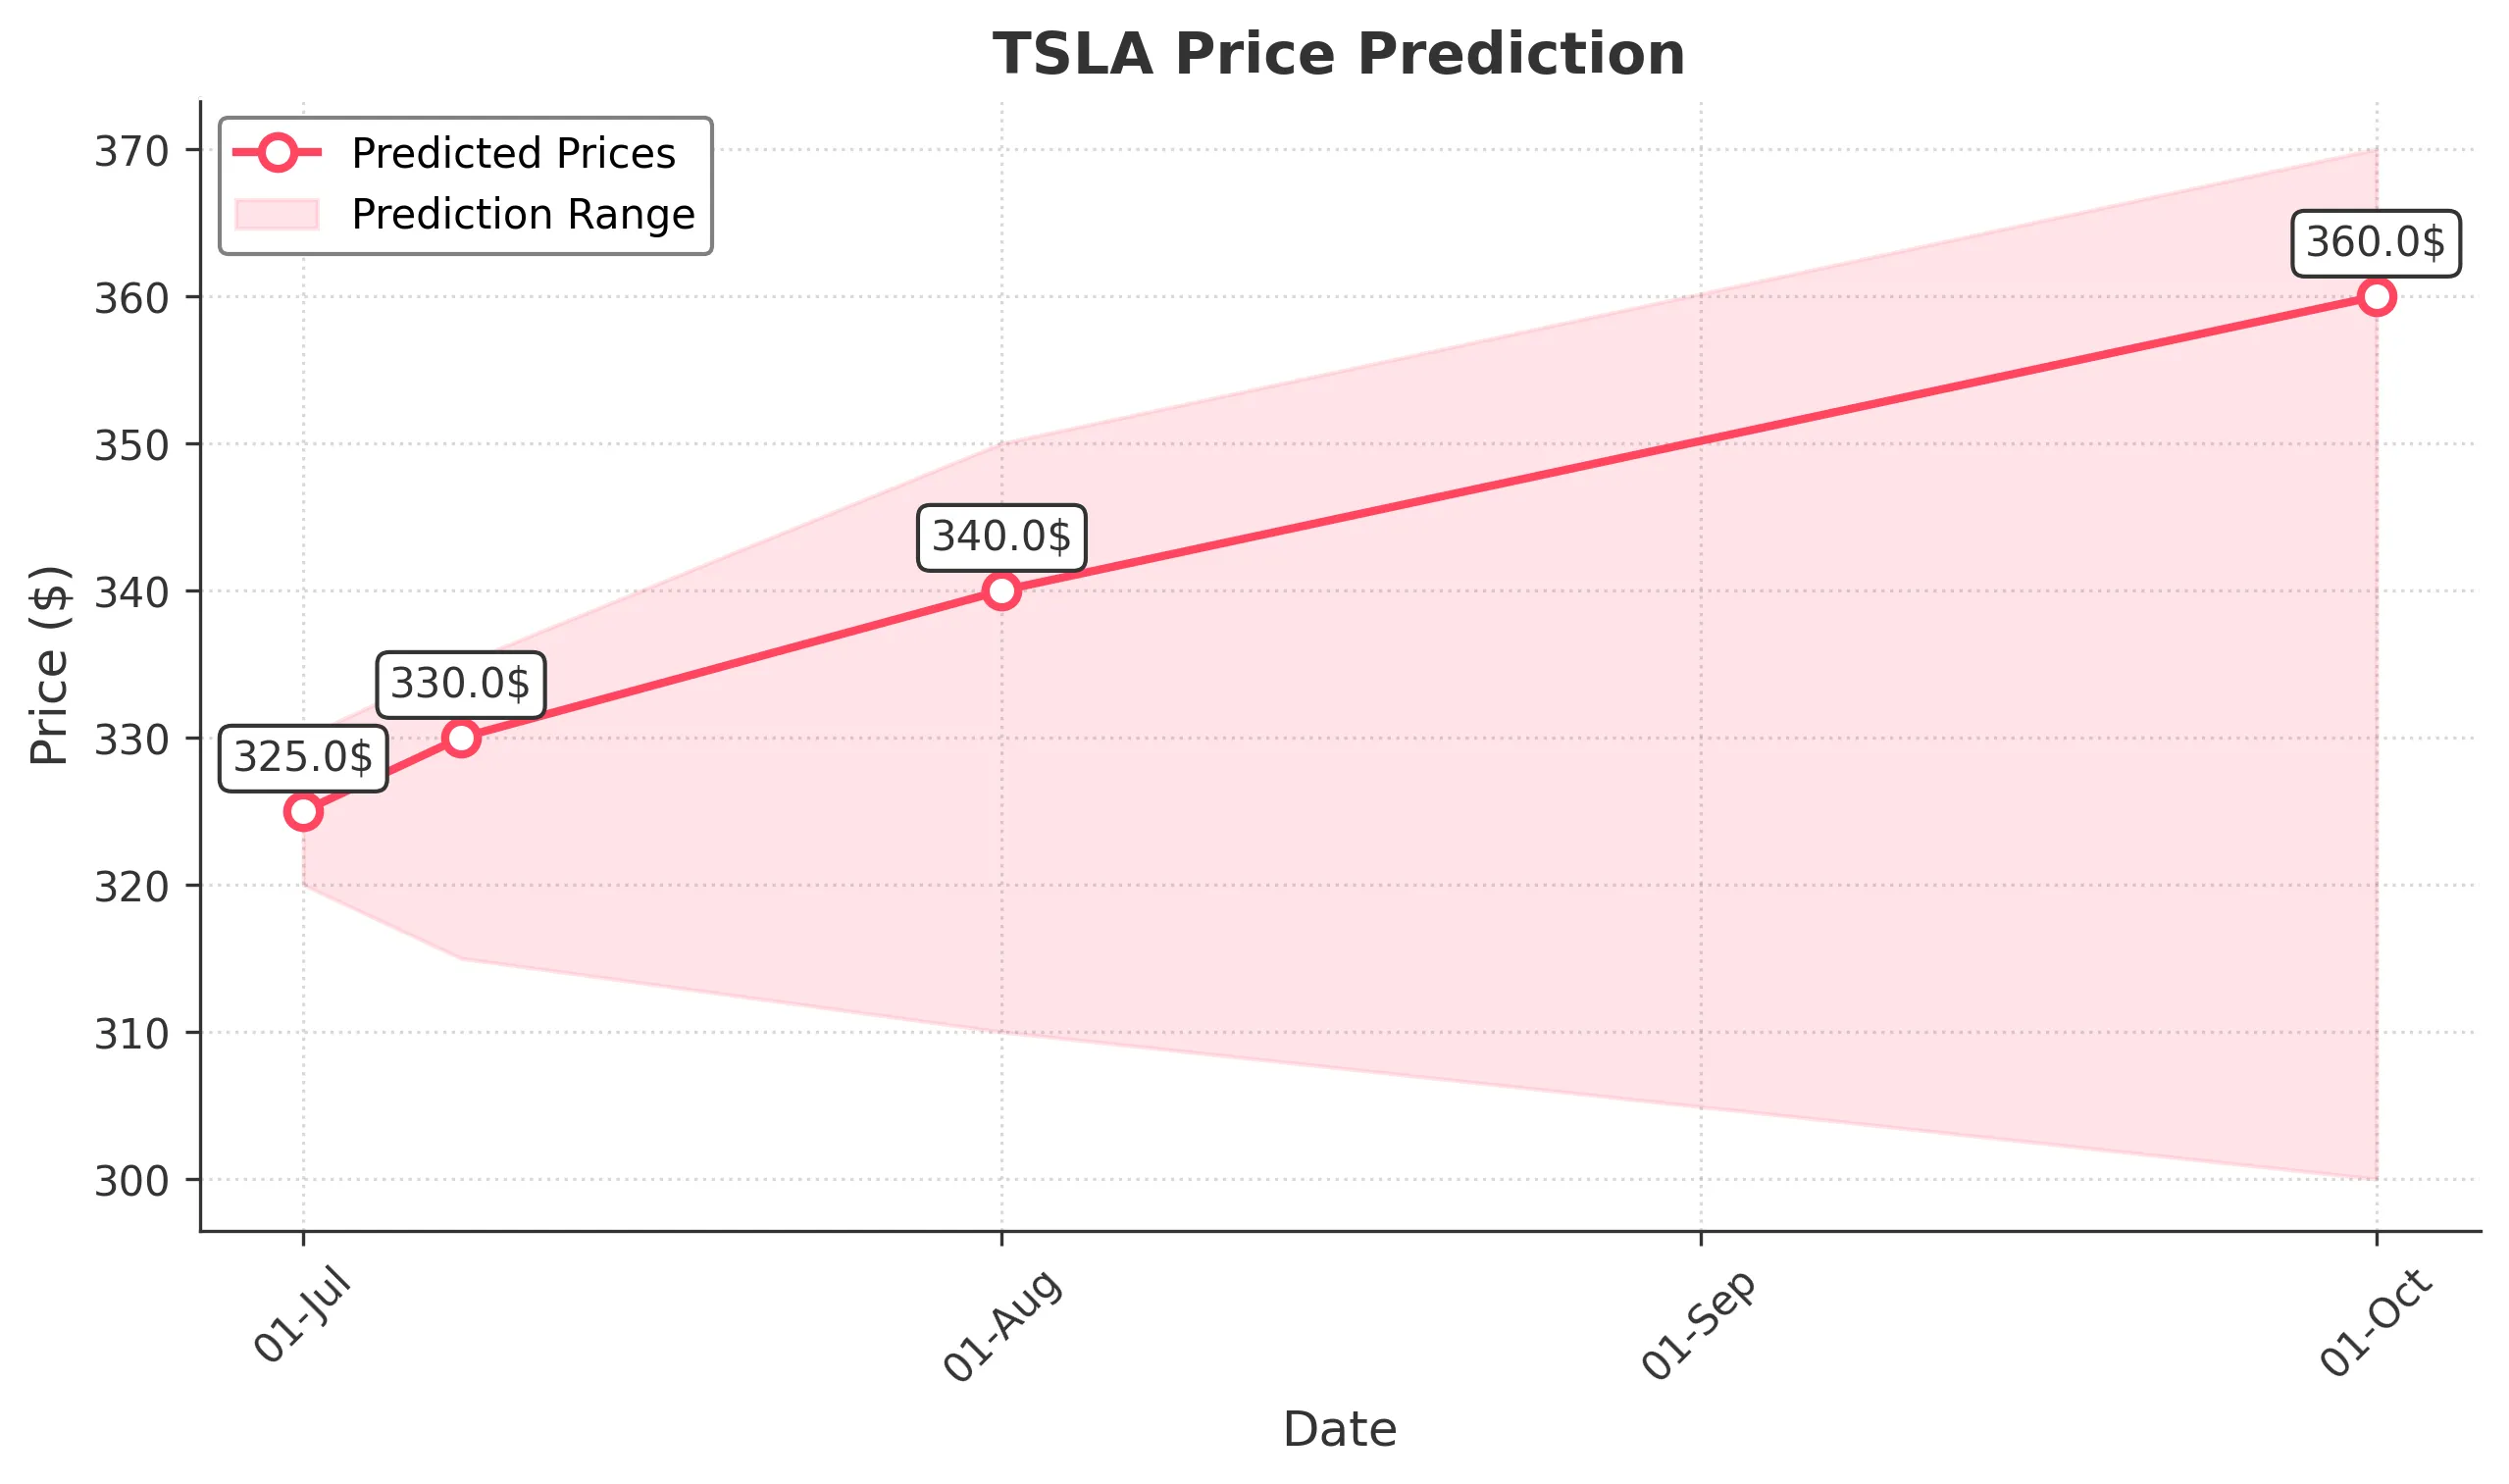
Target: July 1, 2025$325
$323
$330
$320
Description
The stock shows a slight bullish trend with a recent upward movement. The RSI is neutral, indicating no overbought conditions. A potential Doji pattern suggests indecision, but overall sentiment remains positive.
Analysis
Over the past 3 months, TSLA has shown a mix of bullish and bearish trends, with significant support around $320 and resistance near $350. Recent volume spikes indicate strong interest, but the stock has also faced pullbacks, suggesting caution.
Confidence Level
Potential Risks
Market volatility and external news could impact the price unexpectedly.
1 Week Prediction
Target: July 8, 2025$330
$325
$335
$315
Description
The stock is expected to continue its upward trajectory, supported by recent bullish candlestick patterns. The MACD shows a bullish crossover, indicating potential upward momentum. However, resistance at $335 may limit gains.
Analysis
TSLA has experienced fluctuations, with a recent bullish phase. Key support at $320 and resistance at $350 are critical. The MACD and moving averages suggest a bullish outlook, but caution is warranted due to market volatility.
Confidence Level
Potential Risks
Potential market corrections or negative news could reverse the trend.
1 Month Prediction
Target: August 1, 2025$340
$330
$350
$310
Description
The stock is likely to trend upwards, supported by positive market sentiment and technical indicators. The Bollinger Bands indicate potential for upward movement, but the RSI suggests caution as it approaches overbought territory.
Analysis
In the last 3 months, TSLA has shown volatility with a general upward trend. Key support at $310 and resistance at $350 are pivotal. The stock's performance is influenced by broader market trends and macroeconomic factors.
Confidence Level
Potential Risks
Economic factors and competitive pressures could impact performance.
3 Months Prediction
Target: October 1, 2025$360
$340
$370
$300
Description
Long-term outlook remains bullish, driven by strong fundamentals and market sentiment. However, potential resistance at $370 could pose challenges. The ATR indicates increasing volatility, suggesting caution.
Analysis
TSLA's performance over the past 3 months has been characterized by volatility and a general upward trend. Key support at $300 and resistance at $370 are crucial. The stock's future performance will depend on macroeconomic conditions and investor sentiment.
Confidence Level
Potential Risks
Market conditions and external events could lead to significant price fluctuations.