TSLA Trading Predictions
1 Day Prediction
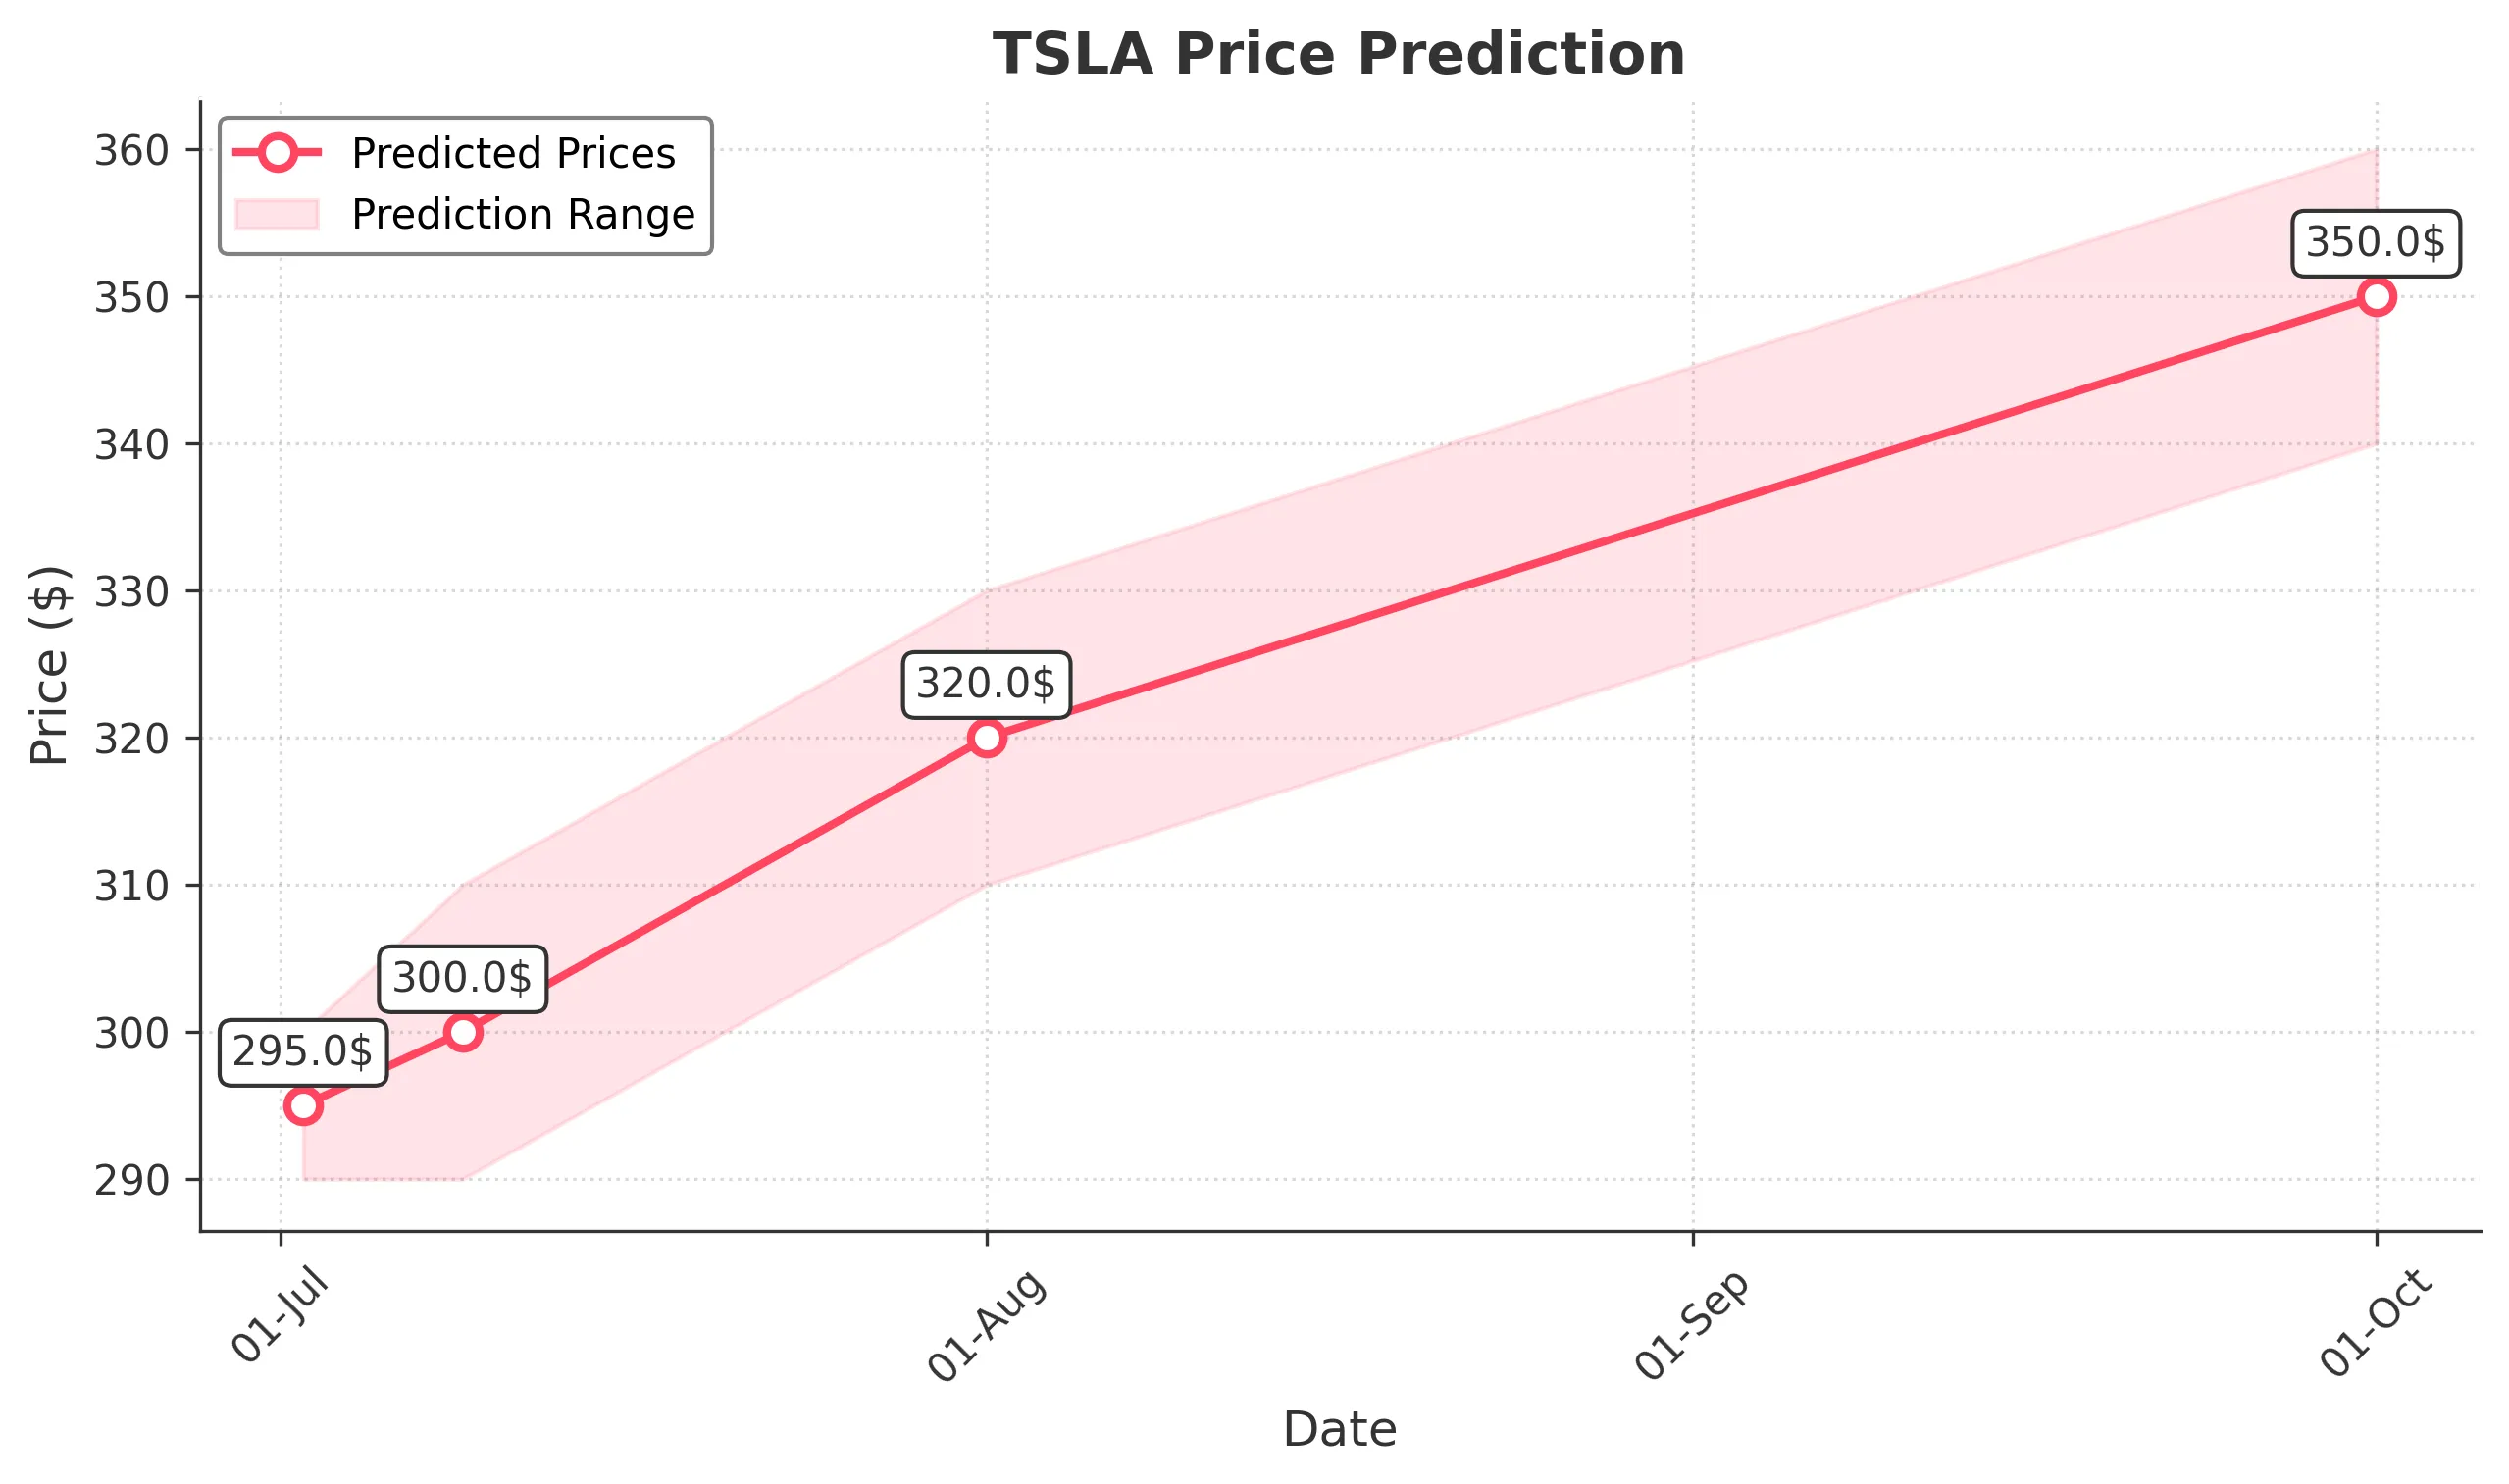
Target: July 2, 2025$295
$294.5
$300
$290
Description
The stock shows a slight bullish trend with a potential bounce from recent lows. RSI indicates oversold conditions, while MACD is showing a bullish crossover. However, volatility remains high, suggesting caution.
Analysis
Over the past 3 months, TSLA has experienced significant volatility, with a bearish trend recently. Key support at $290 and resistance at $350. Volume spikes indicate strong interest, but the overall trend is uncertain.
Confidence Level
Potential Risks
Market sentiment could shift quickly due to macroeconomic news or earnings reports, which may impact the prediction.
1 Week Prediction
Target: July 9, 2025$300
$295
$310
$290
Description
Expect a gradual recovery as the stock may find support around $290. The bullish divergence in RSI suggests potential upward momentum, but resistance at $310 could limit gains.
Analysis
The stock has shown a bearish trend recently, with significant fluctuations. Support at $290 and resistance at $310 are critical. Technical indicators suggest a potential reversal, but caution is warranted.
Confidence Level
Potential Risks
Unforeseen market events or earnings surprises could lead to volatility, impacting the accuracy of this prediction.
1 Month Prediction
Target: August 1, 2025$320
$315
$330
$310
Description
A bullish trend is anticipated as the stock stabilizes above $300. Positive market sentiment and potential news catalysts could drive prices higher, but resistance at $330 remains a concern.
Analysis
TSLA has shown mixed performance with recent bearish trends. Key support at $290 and resistance at $350. Technical indicators suggest a potential recovery, but external factors could influence outcomes.
Confidence Level
Potential Risks
Market volatility and external economic factors could impact the stock's performance, leading to potential downward corrections.
3 Months Prediction
Target: October 1, 2025$350
$345
$360
$340
Description
Long-term bullish sentiment is expected as the stock may break through resistance levels. Positive earnings reports and market conditions could support this upward trend, but caution is advised.
Analysis
The stock has shown significant volatility with a recent bearish trend. Key support at $290 and resistance at $350. Technical indicators suggest potential for recovery, but external factors could influence performance.
Confidence Level
Potential Risks
Potential market corrections and economic uncertainties could lead to volatility, impacting the stock's trajectory.