TSLA Trading Predictions
1 Day Prediction
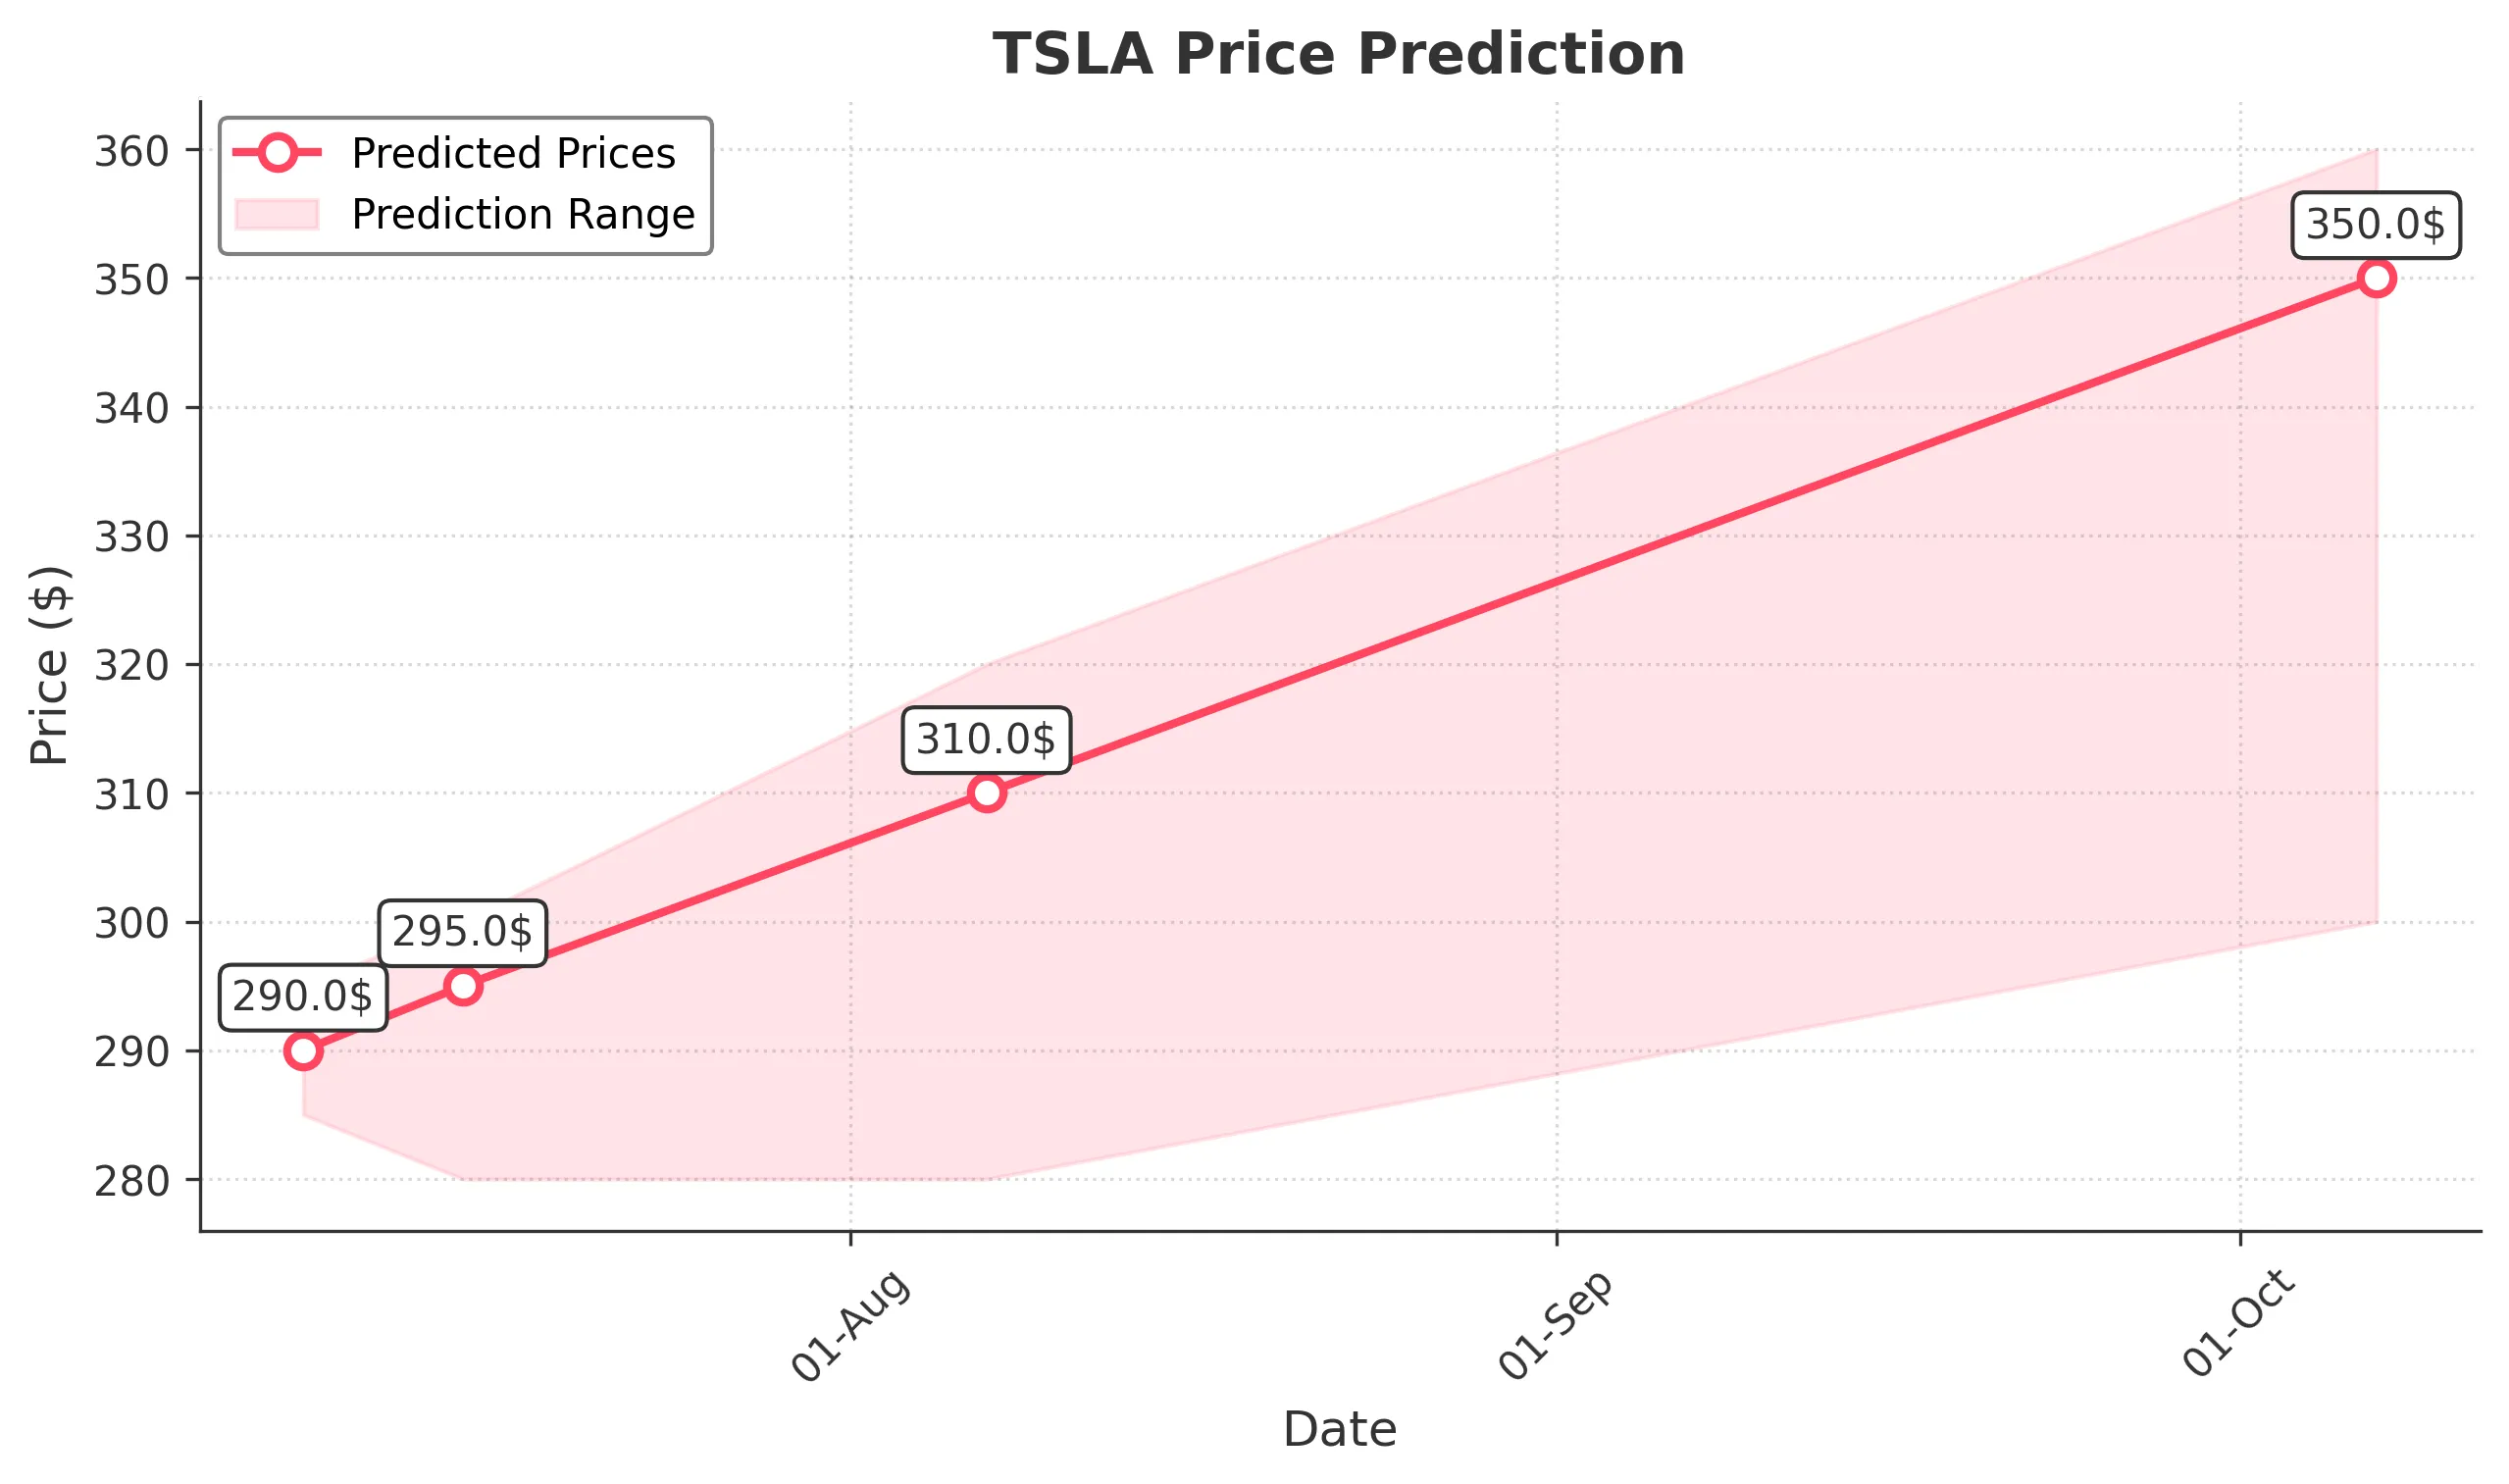
Target: July 8, 2025$290
$290
$295
$285
Description
The stock shows a bearish trend with recent lower highs and lower lows. RSI indicates oversold conditions, suggesting a potential bounce. However, MACD is bearish, and volume has decreased, indicating caution.
Analysis
Over the past 3 months, TSLA has experienced significant volatility, with a recent bearish trend. Key support is around $290, while resistance is near $350. Volume spikes were noted during price drops, indicating selling pressure. Technical indicators suggest caution.
Confidence Level
Potential Risks
Market volatility and external news could impact the prediction. A sudden positive catalyst could lead to a price increase.
1 Week Prediction
Target: July 15, 2025$295
$290
$300
$280
Description
A slight recovery is expected as the stock may find support at $290. However, bearish momentum persists. Watch for potential reversal patterns in candlesticks. Volume may increase if the price stabilizes.
Analysis
The stock has been in a bearish phase, with significant fluctuations. Support at $290 is critical, while resistance is at $350. Technical indicators show mixed signals, with RSI indicating oversold conditions but MACD remaining bearish.
Confidence Level
Potential Risks
Uncertainty remains due to macroeconomic factors and potential earnings reports that could sway investor sentiment.
1 Month Prediction
Target: August 7, 2025$310
$295
$320
$280
Description
Expect a gradual recovery as the stock may stabilize around $310. Positive market sentiment could emerge if earnings reports are favorable. Watch for bullish candlestick patterns.
Analysis
TSLA has shown volatility with a bearish trend recently. Key support at $290 and resistance at $350. Technical indicators suggest potential for recovery, but caution is warranted due to overall market conditions.
Confidence Level
Potential Risks
Market sentiment can shift quickly, and any negative news could reverse the expected trend.
3 Months Prediction
Target: October 7, 2025$350
$320
$360
$300
Description
If the market stabilizes, TSLA could reach $350, driven by positive earnings and market sentiment. However, bearish risks remain if macroeconomic conditions worsen.
Analysis
The stock has been volatile, with a recent bearish trend. Key support at $290 and resistance at $350. Technical indicators show mixed signals, with potential for recovery if market conditions improve.
Confidence Level
Potential Risks
Potential for economic downturns or negative news could impact the stock's performance significantly.