TSLA Trading Predictions
1 Day Prediction
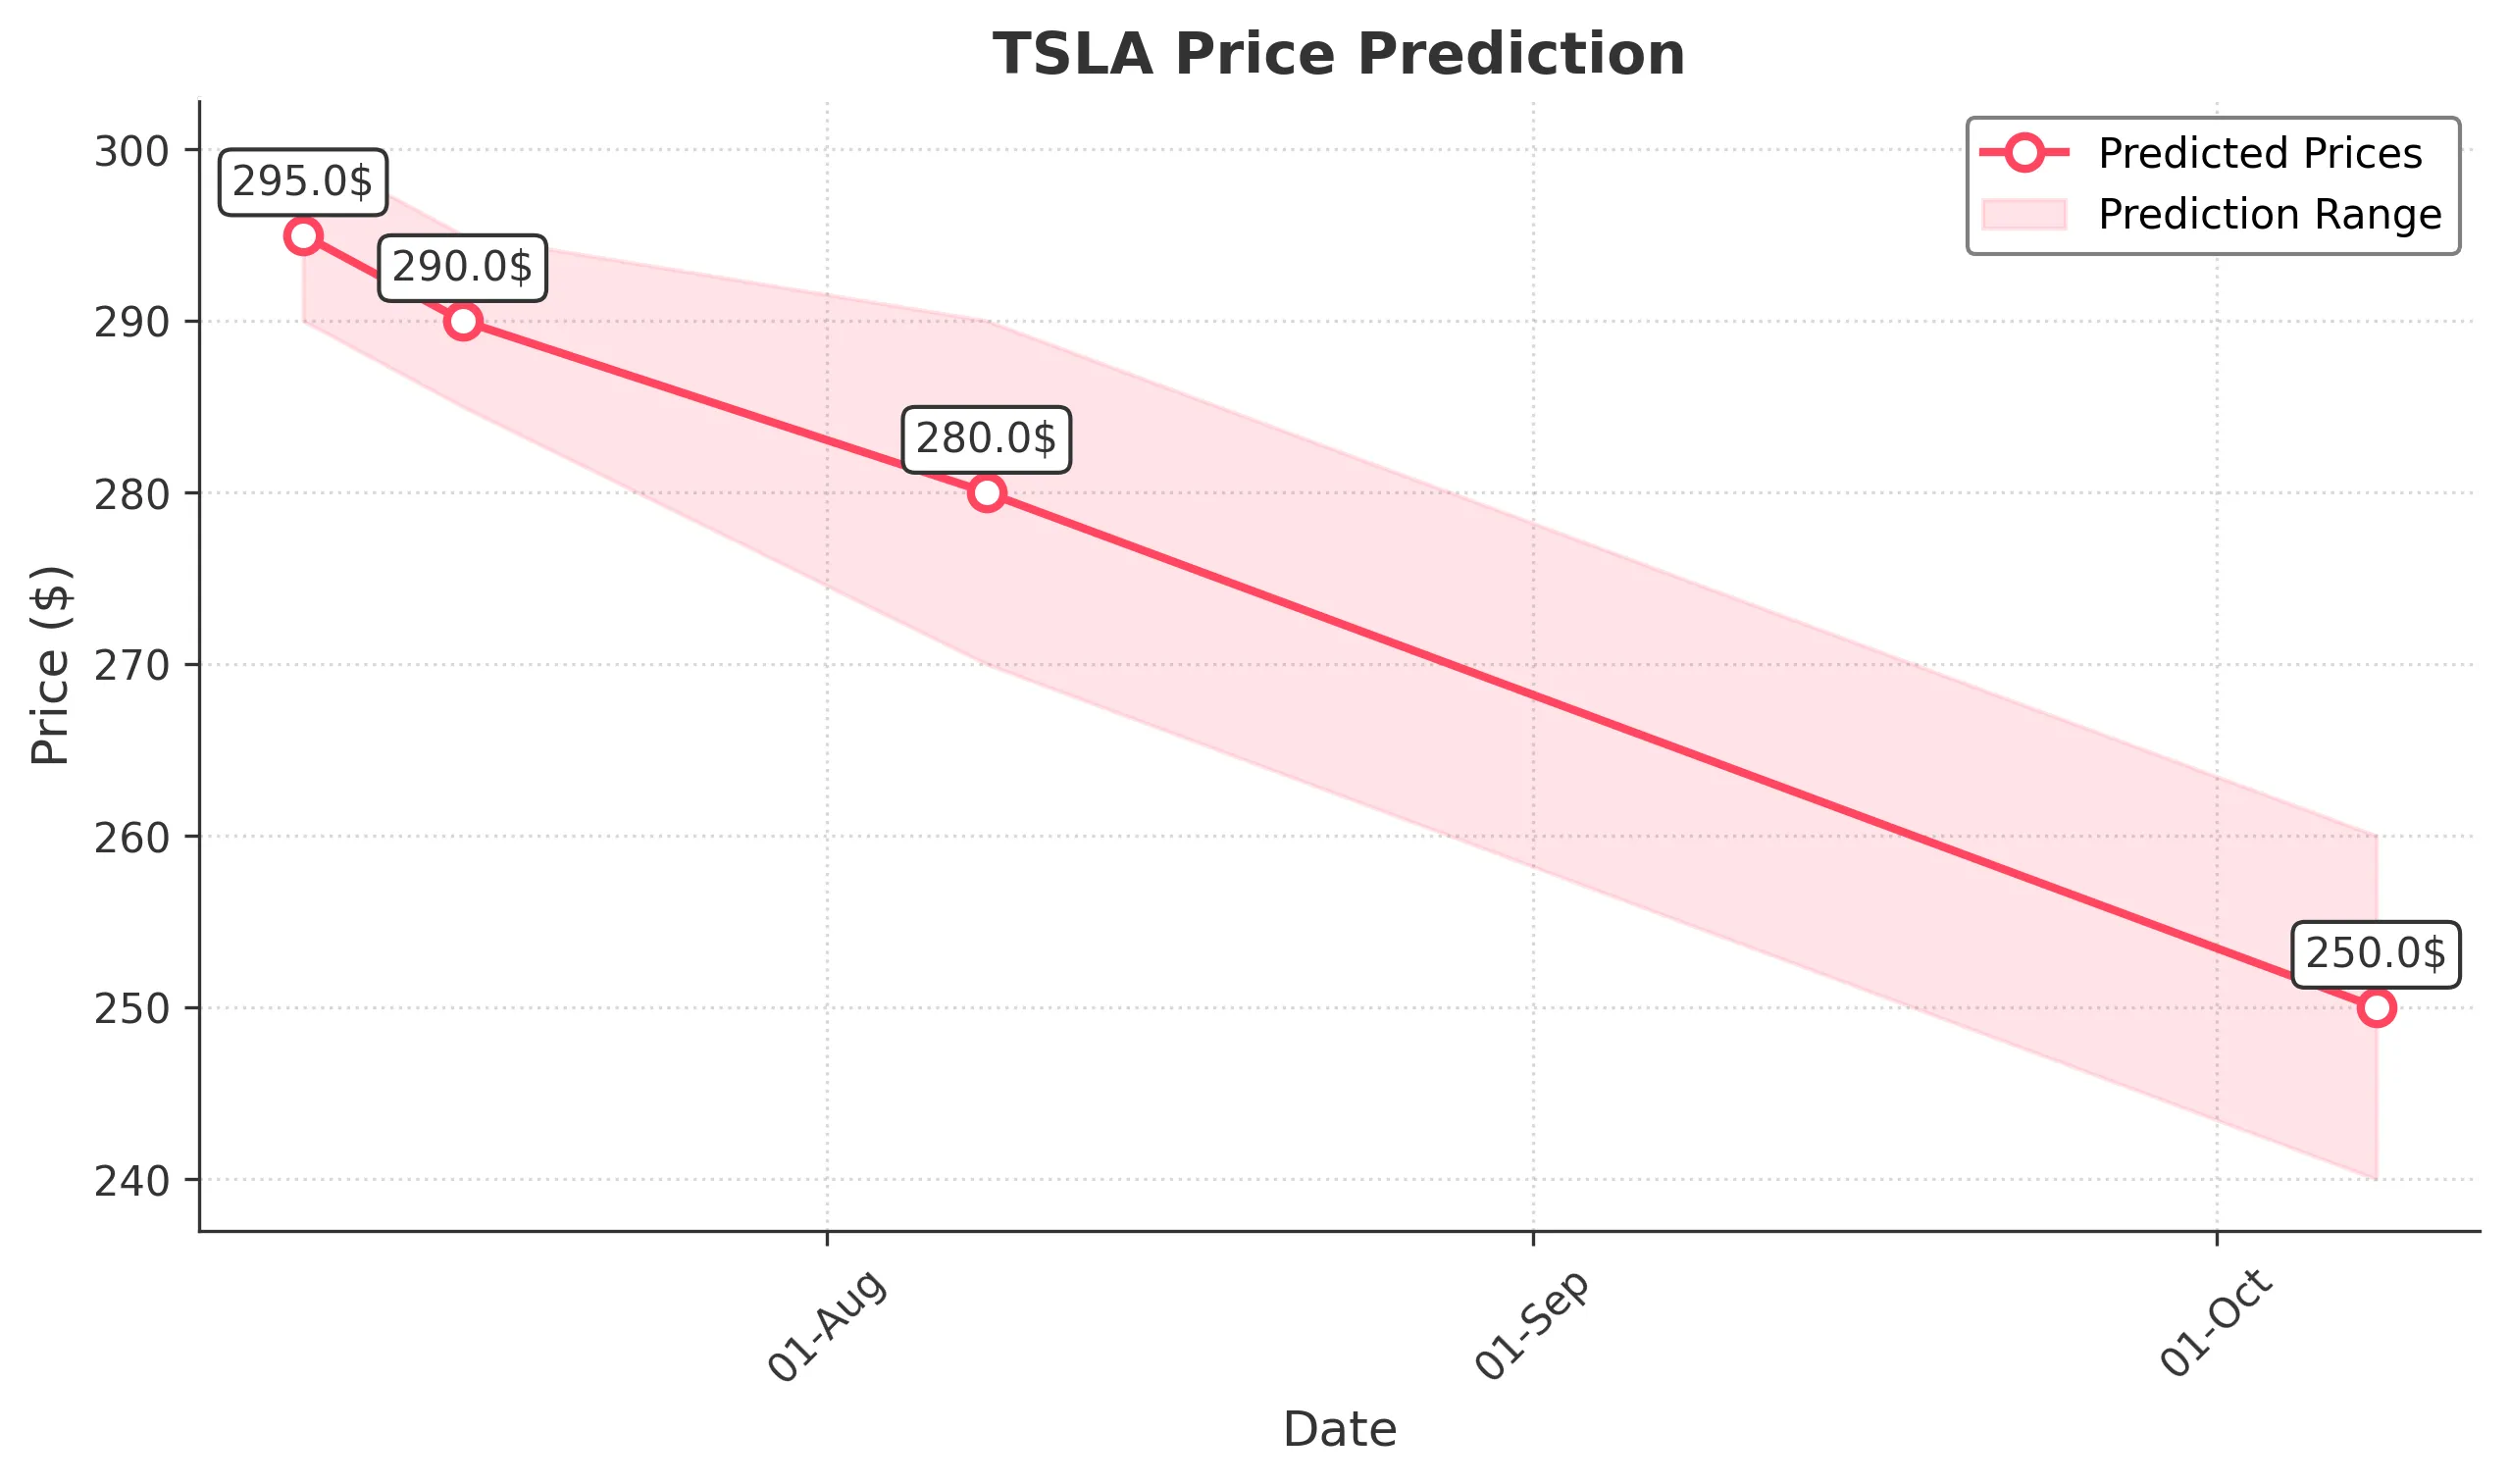
Target: July 9, 2025$295
$295.5
$300
$290
Description
The stock shows a slight bullish trend with a potential close around $295. The recent candlestick patterns indicate indecision, and the RSI is nearing overbought levels, suggesting a possible pullback. Volume remains moderate, indicating steady interest.
Analysis
Over the past 3 months, TSLA has shown a bearish trend with significant fluctuations. Key support is around $290, while resistance is near $300. The RSI indicates potential overbought conditions, and recent volume spikes suggest increased trading activity.
Confidence Level
Potential Risks
Market volatility and external news could impact the price significantly.
1 Week Prediction
Target: July 16, 2025$290
$295
$295
$285
Description
Expect a slight decline to around $290 as the stock faces resistance. The MACD shows bearish divergence, and the Bollinger Bands indicate potential tightening, suggesting a period of consolidation or pullback.
Analysis
The stock has been in a bearish phase with significant resistance at $300. The ATR indicates increasing volatility, and the recent candlestick patterns suggest indecision. Volume analysis shows spikes during sell-offs, indicating bearish sentiment.
Confidence Level
Potential Risks
Unforeseen market events or earnings reports could lead to unexpected volatility.
1 Month Prediction
Target: August 8, 2025$280
$285
$290
$270
Description
A bearish outlook suggests a decline to $280. The Fibonacci retracement levels indicate strong resistance at $300, and the RSI is trending downwards, indicating potential weakness in buying momentum.
Analysis
TSLA has experienced significant volatility, with key support at $270. The moving averages indicate a bearish crossover, and the recent price action suggests a potential downtrend. Volume patterns show increased selling pressure.
Confidence Level
Potential Risks
Market sentiment can shift rapidly, especially with macroeconomic factors at play.
3 Months Prediction
Target: October 8, 2025$250
$255
$260
$240
Description
Long-term bearish sentiment suggests a decline to $250. The MACD indicates a bearish trend, and the overall market sentiment is cautious. Potential macroeconomic factors could further impact the stock negatively.
Analysis
Over the last three months, TSLA has shown a bearish trend with significant resistance at $300. The stock's volatility is increasing, and the ATR suggests potential for larger price swings. Volume analysis indicates a shift towards selling pressure.
Confidence Level
Potential Risks
Economic indicators and company performance reports could lead to unexpected price movements.