TSLA Trading Predictions
1 Day Prediction
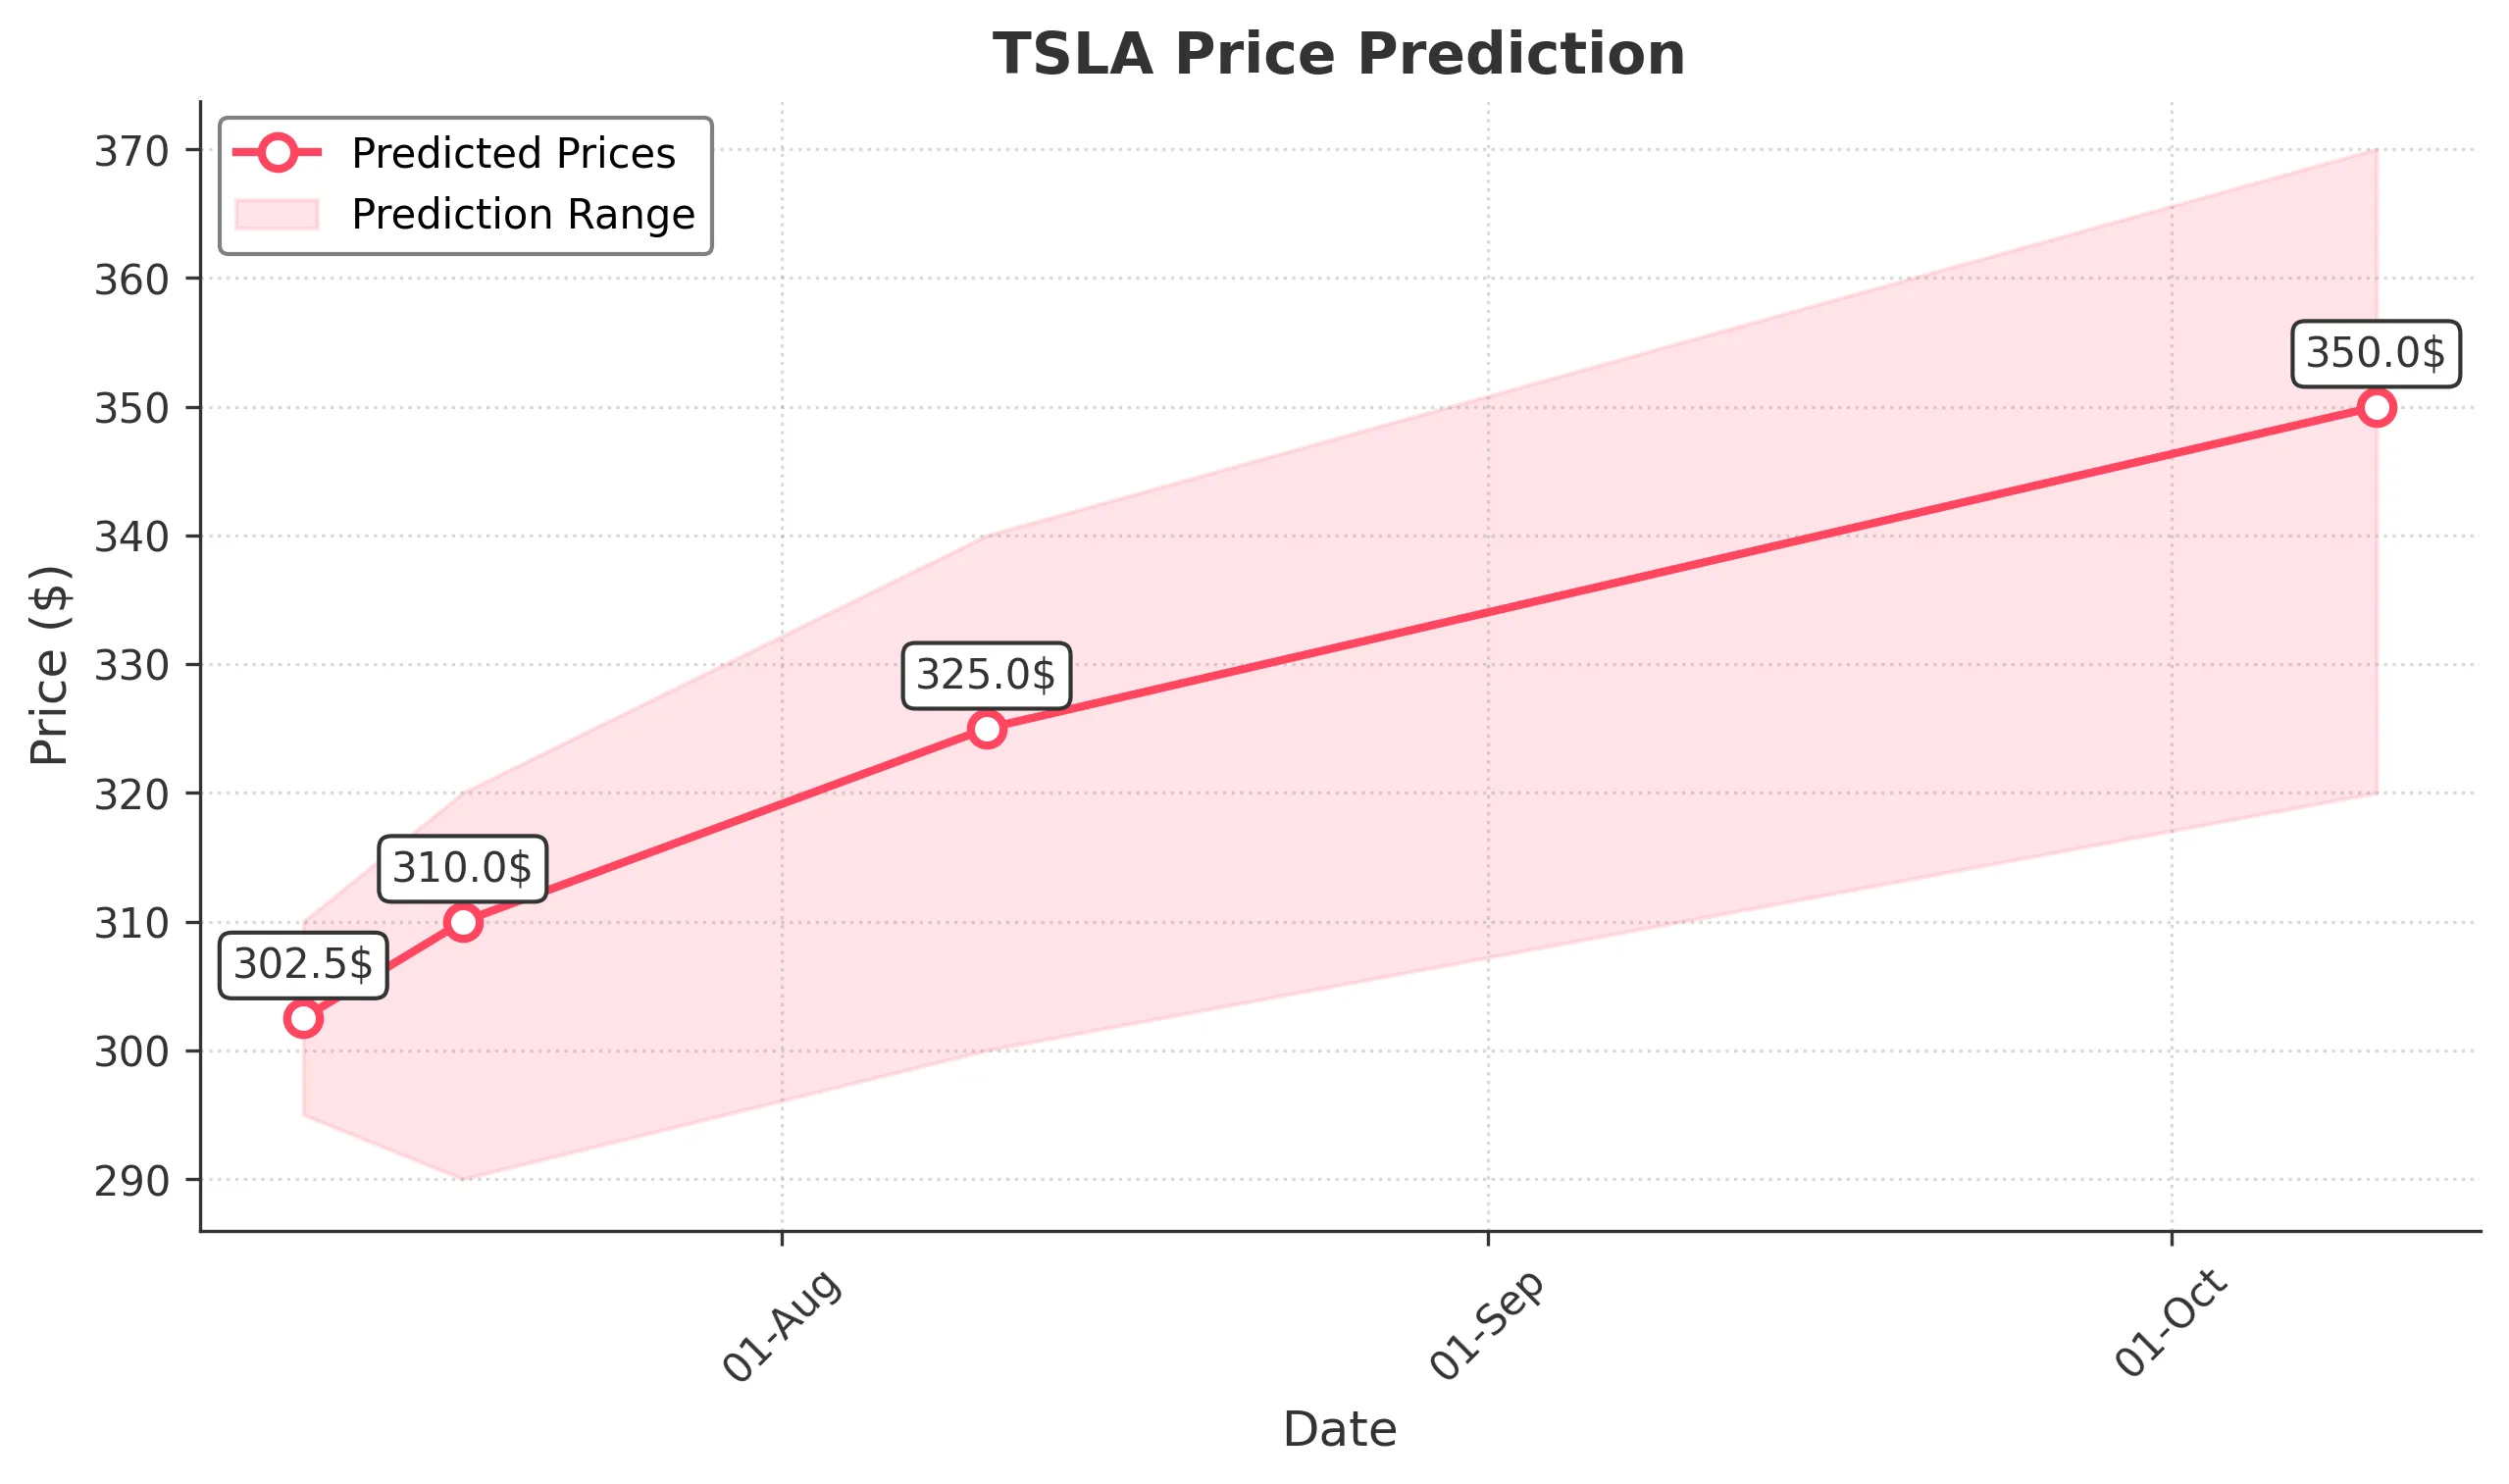
Target: July 11, 2025$302.5
$300
$310
$295
Description
The stock shows a slight bullish trend with a potential bounce from recent lows. RSI indicates oversold conditions, while MACD is showing a bullish crossover. However, volatility remains high, suggesting caution.
Analysis
Over the past 3 months, TSLA has experienced significant volatility, with a recent bearish trend followed by a recovery. Key support at $290 and resistance at $350. Volume spikes indicate strong interest, but macroeconomic factors could influence future performance.
Confidence Level
Potential Risks
Market sentiment could shift quickly due to external news or earnings reports, which may impact the prediction.
1 Week Prediction
Target: July 18, 2025$310
$302.5
$320
$290
Description
Expect a gradual recovery as bullish momentum builds. The 50-day moving average is trending upwards, and recent candlestick patterns suggest a reversal. However, market volatility remains a concern.
Analysis
TSLA has shown a mix of bullish and bearish signals. The recent price action indicates a possible reversal, but the overall trend remains uncertain. Key support at $290 and resistance at $350. Volume patterns suggest increased trading activity.
Confidence Level
Potential Risks
Potential for sudden market shifts due to economic data releases or geopolitical events could affect the stock's trajectory.
1 Month Prediction
Target: August 10, 2025$325
$310
$340
$300
Description
A bullish outlook is anticipated as the stock stabilizes above key support levels. The MACD indicates a strengthening trend, and RSI is moving towards neutral. However, external factors could still pose risks.
Analysis
The past three months have shown significant fluctuations, with a recent recovery phase. Key support at $290 and resistance at $350. Technical indicators suggest a potential upward trend, but external market conditions must be monitored closely.
Confidence Level
Potential Risks
Economic indicators and earnings reports could lead to unexpected volatility, impacting the stock's performance.
3 Months Prediction
Target: October 10, 2025$350
$325
$370
$320
Description
Long-term bullish sentiment is expected as the stock approaches key resistance levels. The overall trend appears positive, supported by strong volume and favorable technical indicators. However, macroeconomic uncertainties could impact this outlook.
Analysis
TSLA's performance over the last three months has been characterized by volatility and recovery. Key support at $290 and resistance at $350. Technical indicators suggest a bullish trend, but external factors must be considered for future predictions.
Confidence Level
Potential Risks
Potential market corrections or negative news could lead to price declines, affecting the overall bullish sentiment.