TSLA Trading Predictions
1 Day Prediction
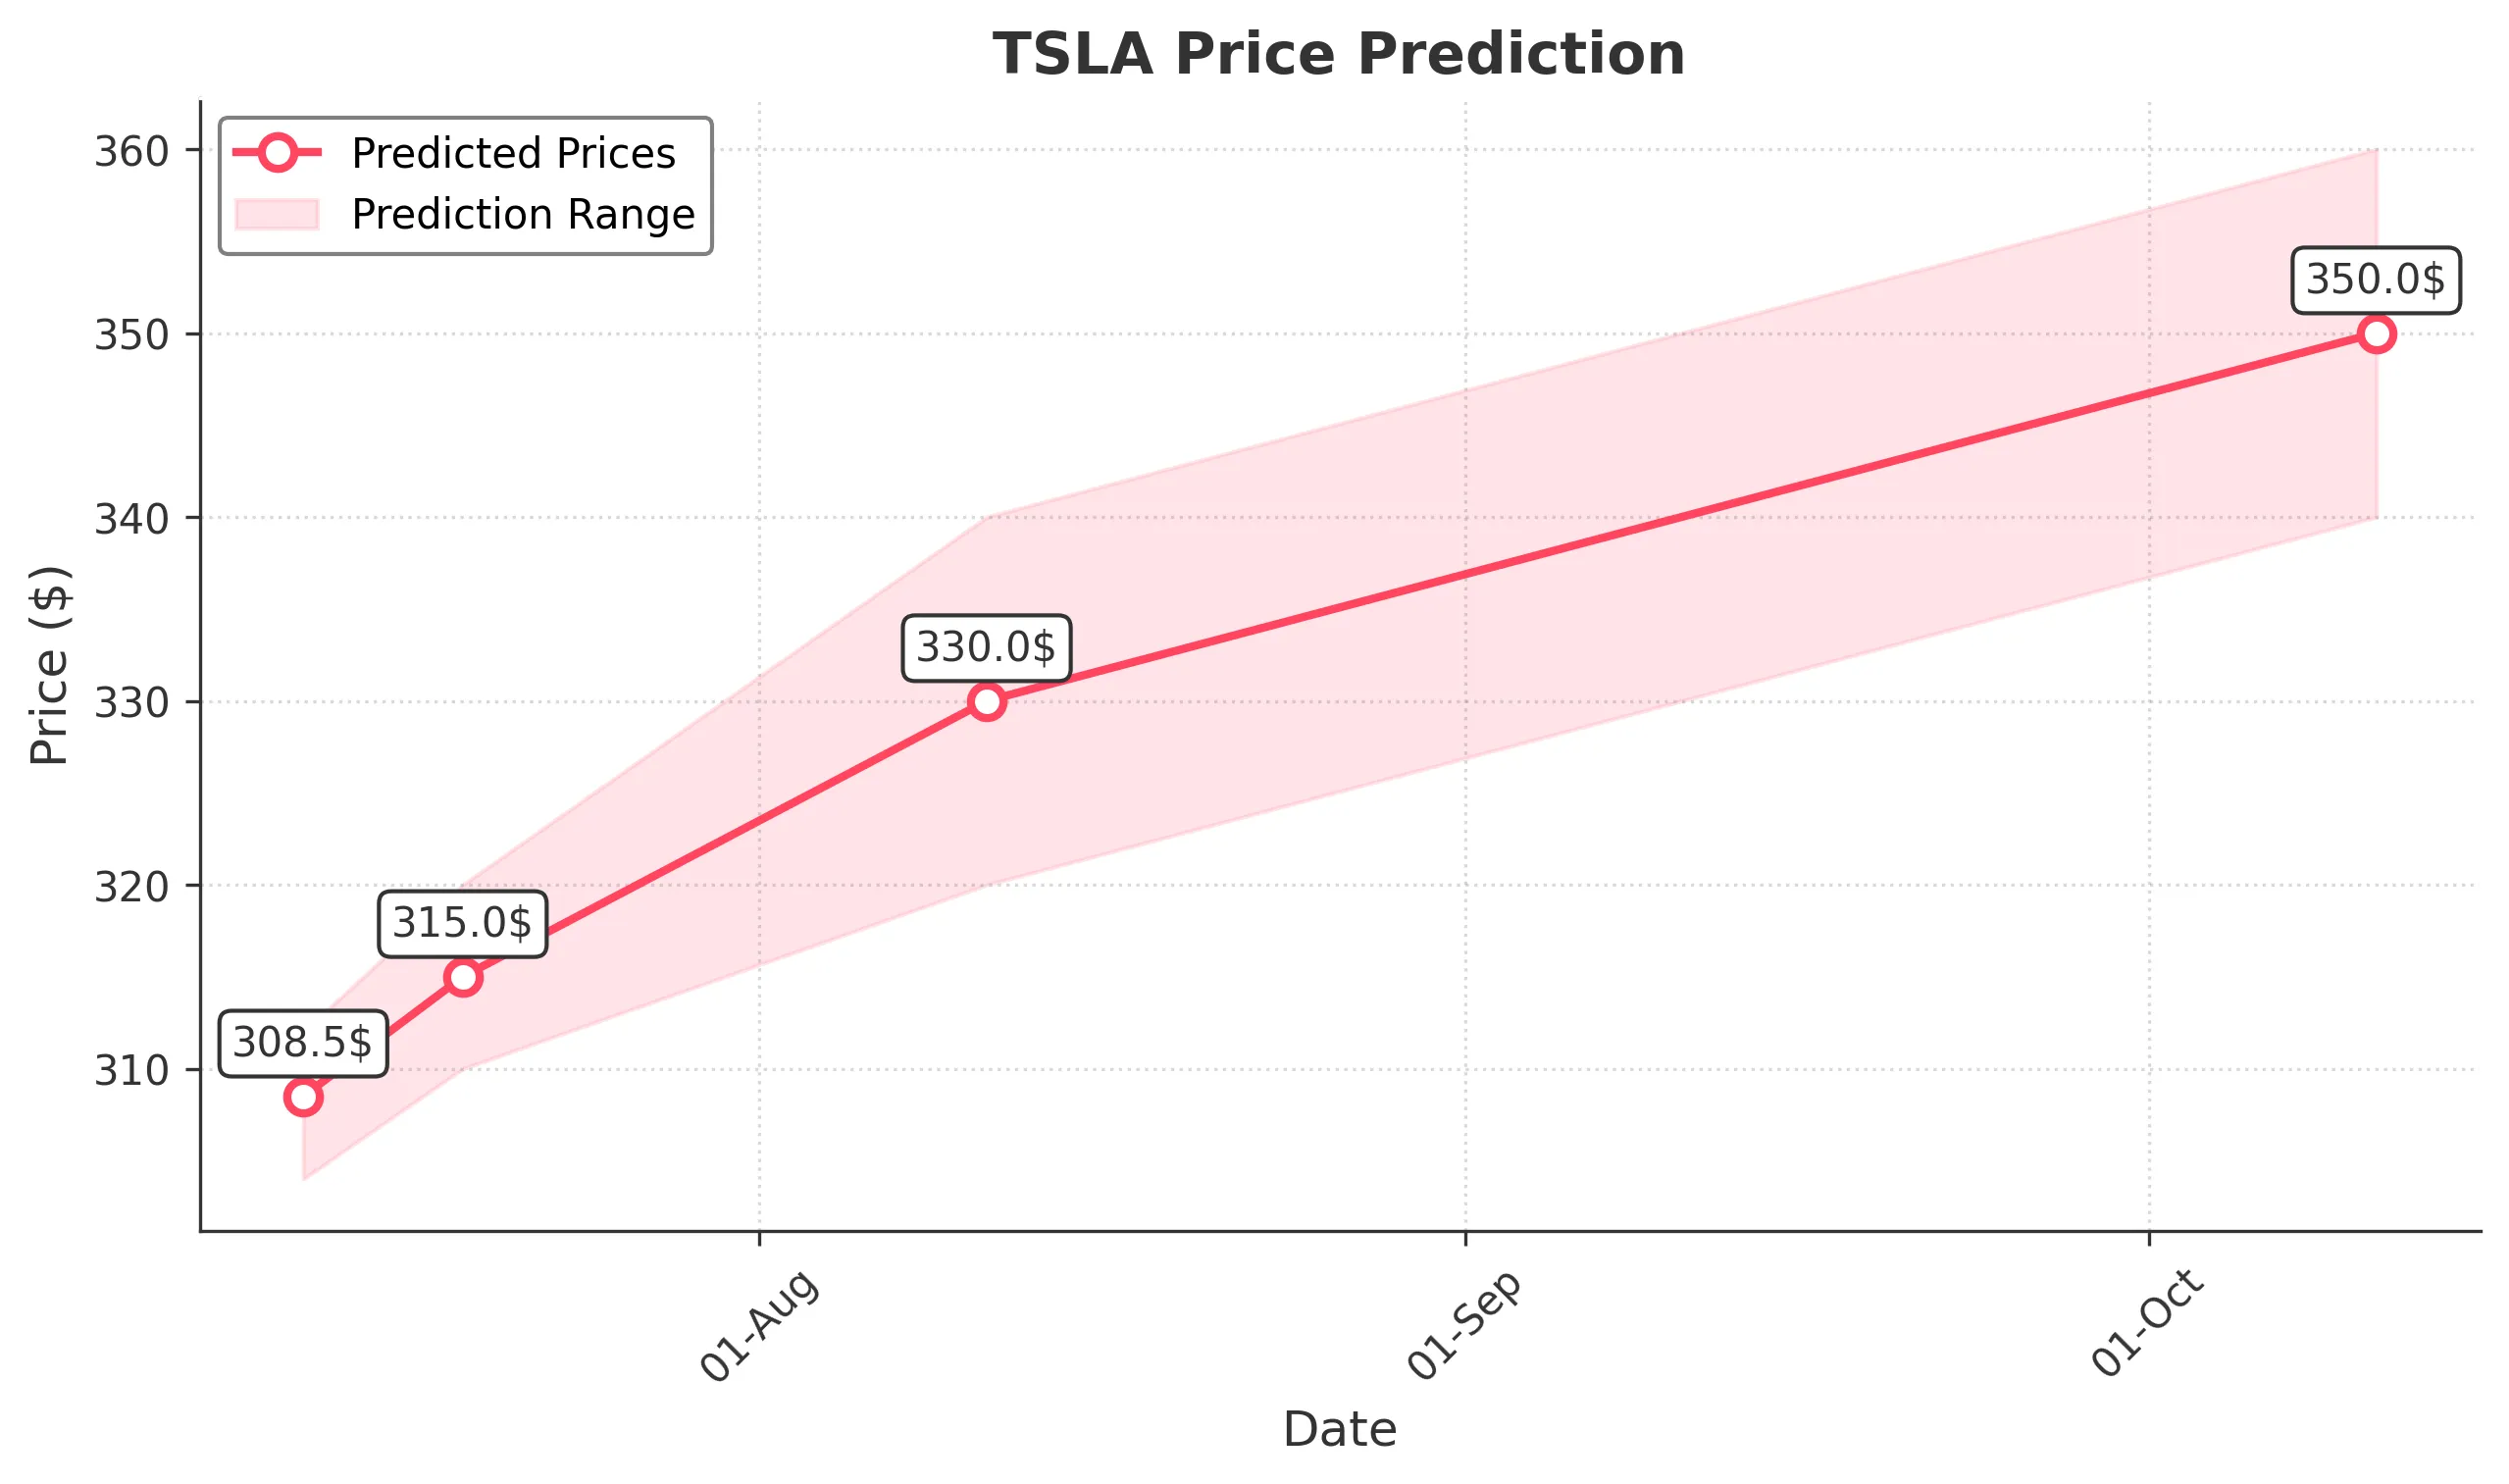
Target: July 12, 2025$308.5
$307
$312
$304
Description
The stock shows a slight bullish trend with a potential close around 308.5. The recent candlestick patterns indicate indecision, but the RSI is neutral, suggesting a possible upward move. Volume is expected to be moderate.
Analysis
Over the past 3 months, TSLA has shown a bearish trend with significant fluctuations. Key support is around 300, while resistance is near 350. The RSI indicates neutral momentum, and recent volume spikes suggest increased interest. Overall, the market sentiment remains cautious.
Confidence Level
Potential Risks
Market volatility and external news could impact the price significantly.
1 Week Prediction
Target: July 19, 2025$315
$312
$320
$310
Description
A bullish reversal is anticipated as the stock approaches key resistance levels. The MACD shows a potential crossover, indicating upward momentum. However, the market remains sensitive to macroeconomic factors.
Analysis
TSLA has experienced a volatile period with a recent bearish trend. Support is at 300, while resistance is at 350. The MACD and Bollinger Bands suggest a possible upward breakout, but caution is advised due to market sentiment.
Confidence Level
Potential Risks
Potential market corrections and external economic news could lead to unexpected price movements.
1 Month Prediction
Target: August 11, 2025$330
$325
$340
$320
Description
The stock is expected to trend upwards as it approaches the 330 mark, supported by bullish patterns and a favorable MACD. However, the RSI indicates overbought conditions, which could lead to corrections.
Analysis
In the last three months, TSLA has shown significant volatility with a bearish trend recently. Key support is at 300, and resistance is at 350. The RSI indicates potential overbought conditions, and volume patterns suggest cautious optimism.
Confidence Level
Potential Risks
Market corrections and external economic factors could hinder upward momentum.
3 Months Prediction
Target: October 11, 2025$350
$345
$360
$340
Description
A bullish trend is anticipated as TSLA approaches the 350 mark, supported by positive market sentiment and technical indicators. However, the potential for market corrections remains a concern.
Analysis
TSLA has shown a mixed performance over the past three months, with key support at 300 and resistance at 350. The stock's volatility is notable, and while there are bullish signals, external factors could lead to price fluctuations.
Confidence Level
Potential Risks
Unforeseen macroeconomic events and market volatility could significantly impact the stock's performance.