TSLA Trading Predictions
1 Day Prediction
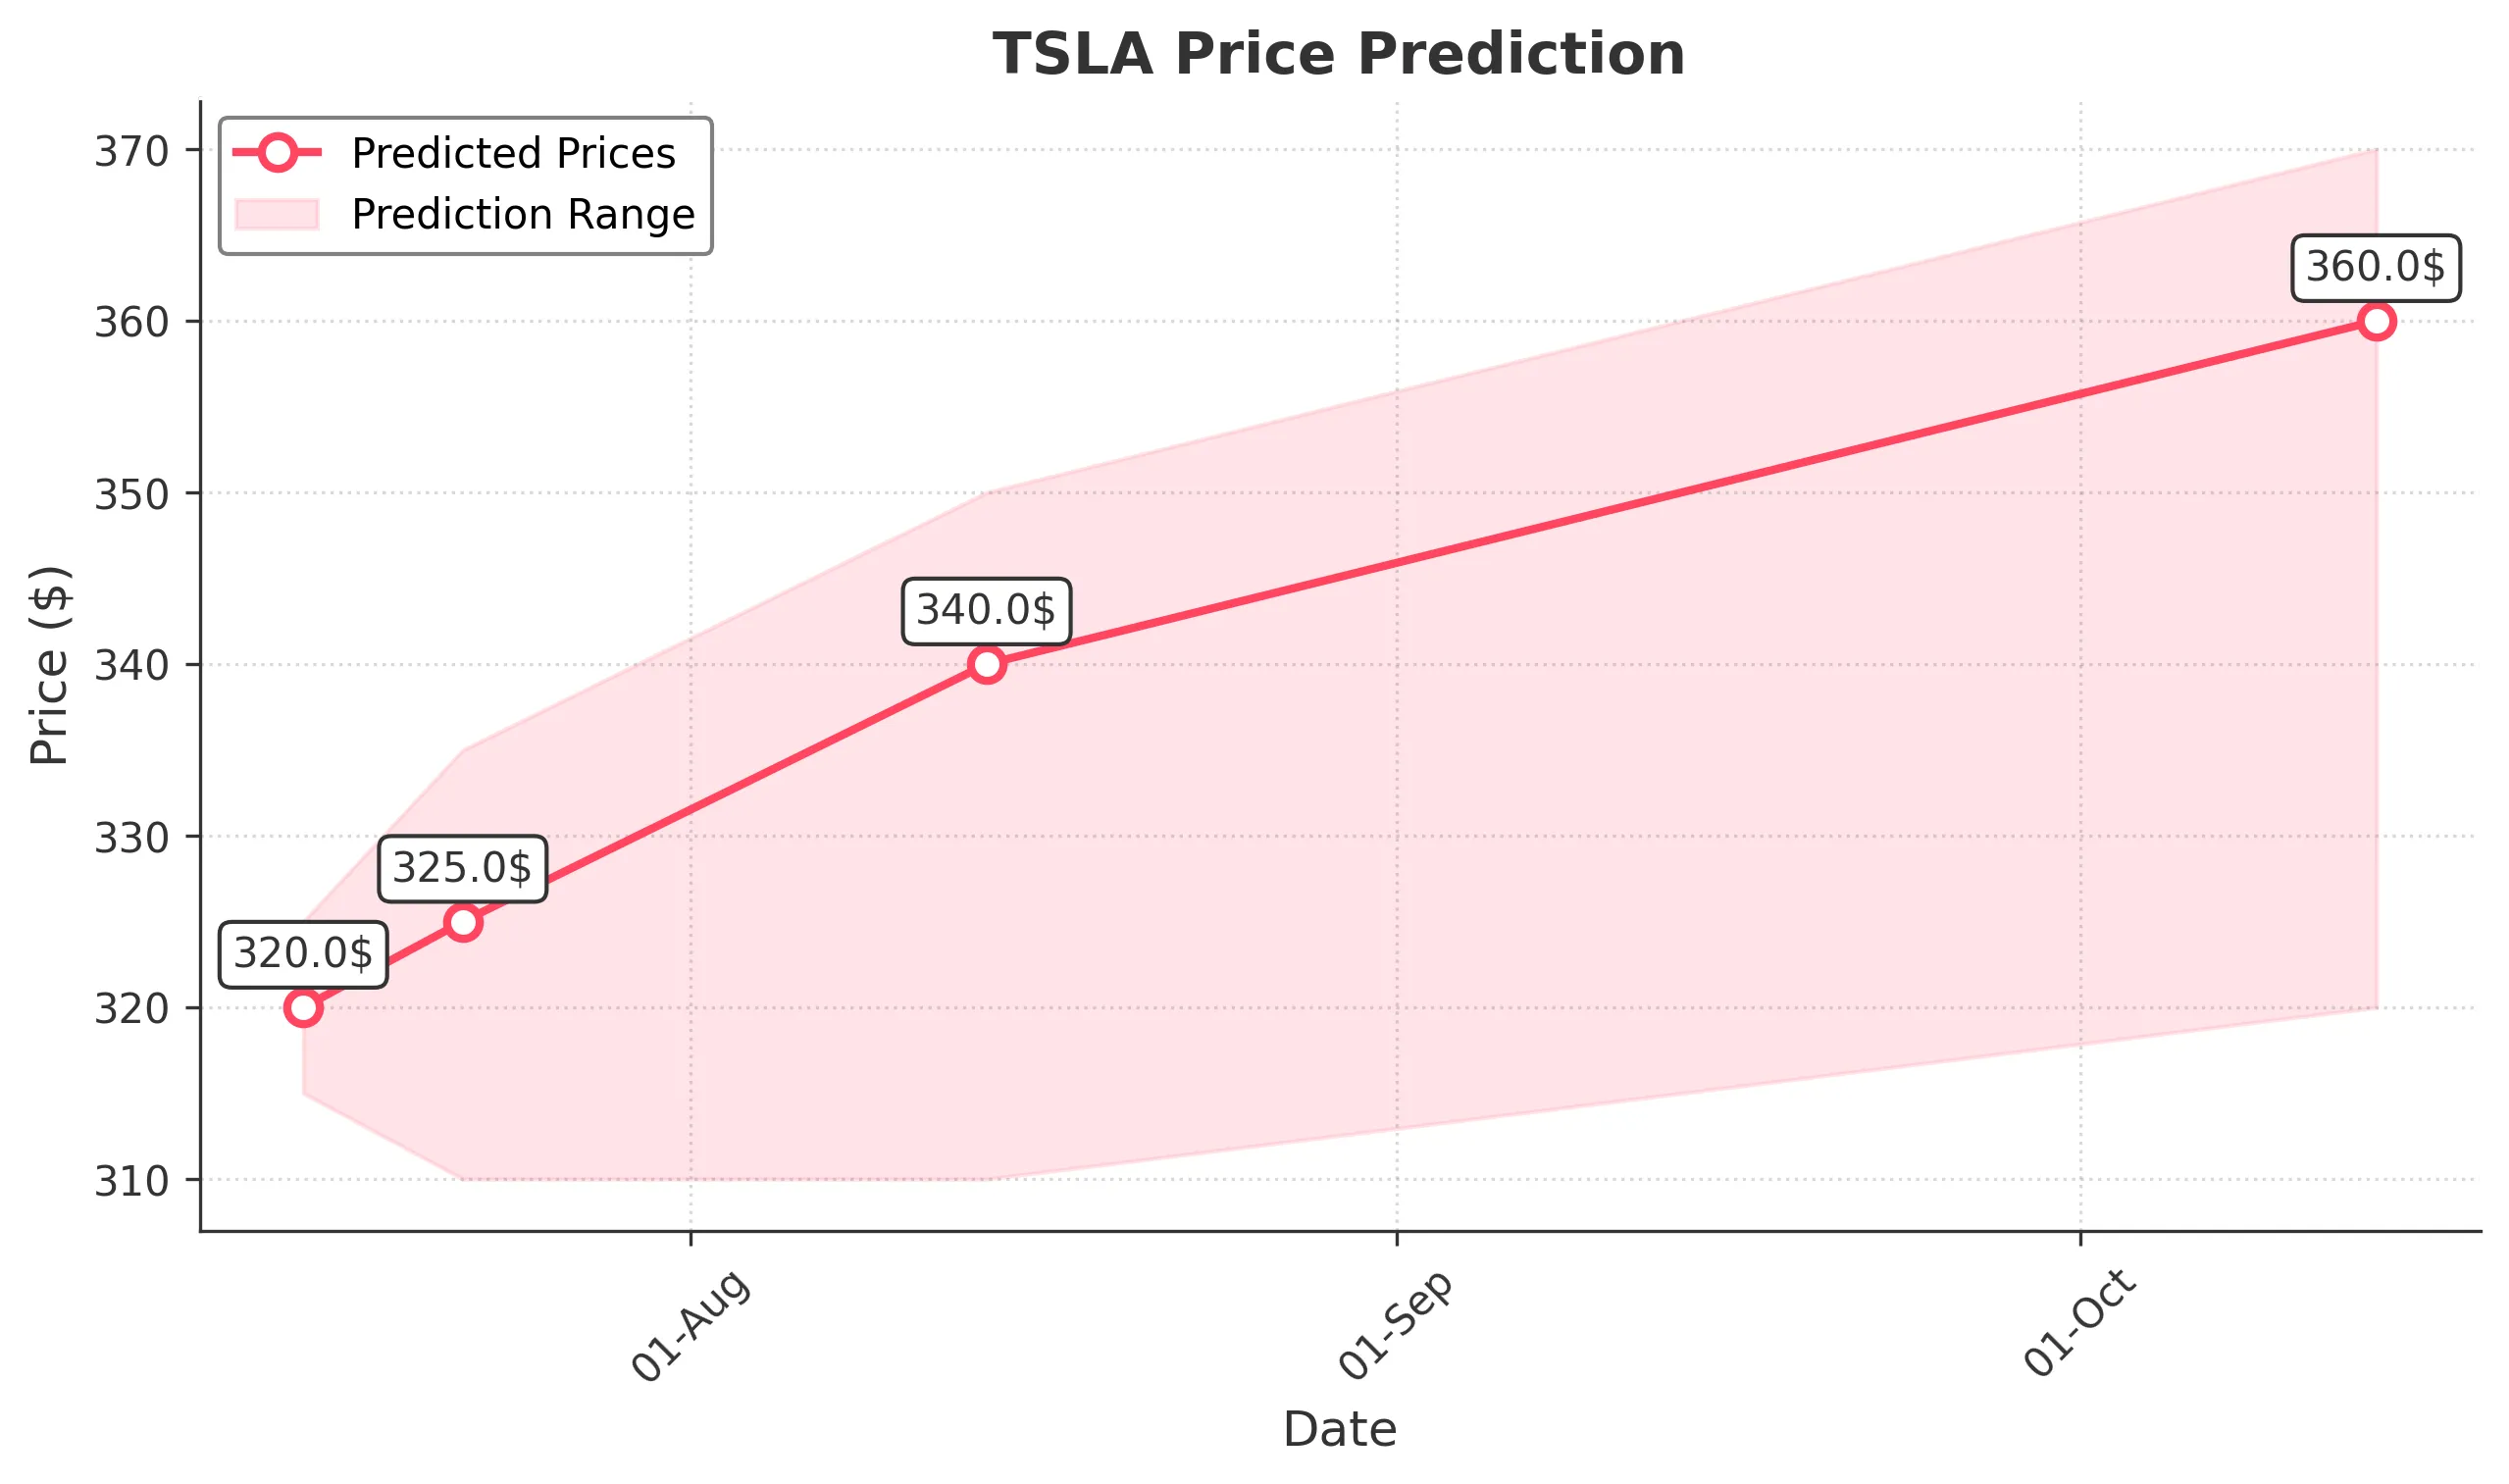
Target: July 15, 2025$320
$318
$325
$315
Description
The stock shows a slight bullish trend with a recent Doji pattern indicating indecision. RSI is neutral, and MACD is close to crossing above the signal line, suggesting potential upward momentum. However, volatility remains high.
Analysis
Over the past 3 months, TSLA has experienced significant volatility, with a recent bullish trend after a dip. Key support is around $300, while resistance is near $350. Volume spikes indicate strong interest, but the market remains sensitive to external factors.
Confidence Level
Potential Risks
Market sentiment could shift quickly due to macroeconomic news or earnings reports, which may impact the prediction.
1 Week Prediction
Target: July 22, 2025$325
$320
$335
$310
Description
The stock is expected to continue its upward trajectory, supported by recent bullish candlestick patterns. The MACD shows potential for further gains, but RSI indicates overbought conditions, suggesting a possible pullback.
Analysis
TSLA has shown a recovery from recent lows, with strong buying volume. The stock is currently in a bullish phase, but overbought conditions could lead to short-term corrections. Key resistance at $335 may limit upside potential.
Confidence Level
Potential Risks
Potential market corrections or negative news could lead to a reversal, impacting the accuracy of this prediction.
1 Month Prediction
Target: August 14, 2025$340
$330
$350
$310
Description
Expect continued bullish momentum as the stock approaches key Fibonacci retracement levels. However, the RSI indicates potential overbought conditions, which could lead to volatility and corrections.
Analysis
The stock has been trending upward, with significant support at $310 and resistance at $350. Recent volume trends suggest strong investor interest, but caution is warranted due to potential market corrections.
Confidence Level
Potential Risks
Market sentiment can shift rapidly, and external factors such as economic data releases may impact stock performance.
3 Months Prediction
Target: October 14, 2025$360
$350
$370
$320
Description
Long-term bullish outlook supported by strong fundamentals and market sentiment. However, potential economic headwinds could create volatility. Watch for key earnings reports that may influence price action.
Analysis
TSLA has shown resilience with a bullish trend over the past months. Key support at $320 and resistance at $370 indicate a potential range. The stock's performance will be influenced by broader market conditions and company-specific news.
Confidence Level
Potential Risks
Unforeseen macroeconomic events or changes in market sentiment could lead to significant price fluctuations.