TSLA Trading Predictions
1 Day Prediction
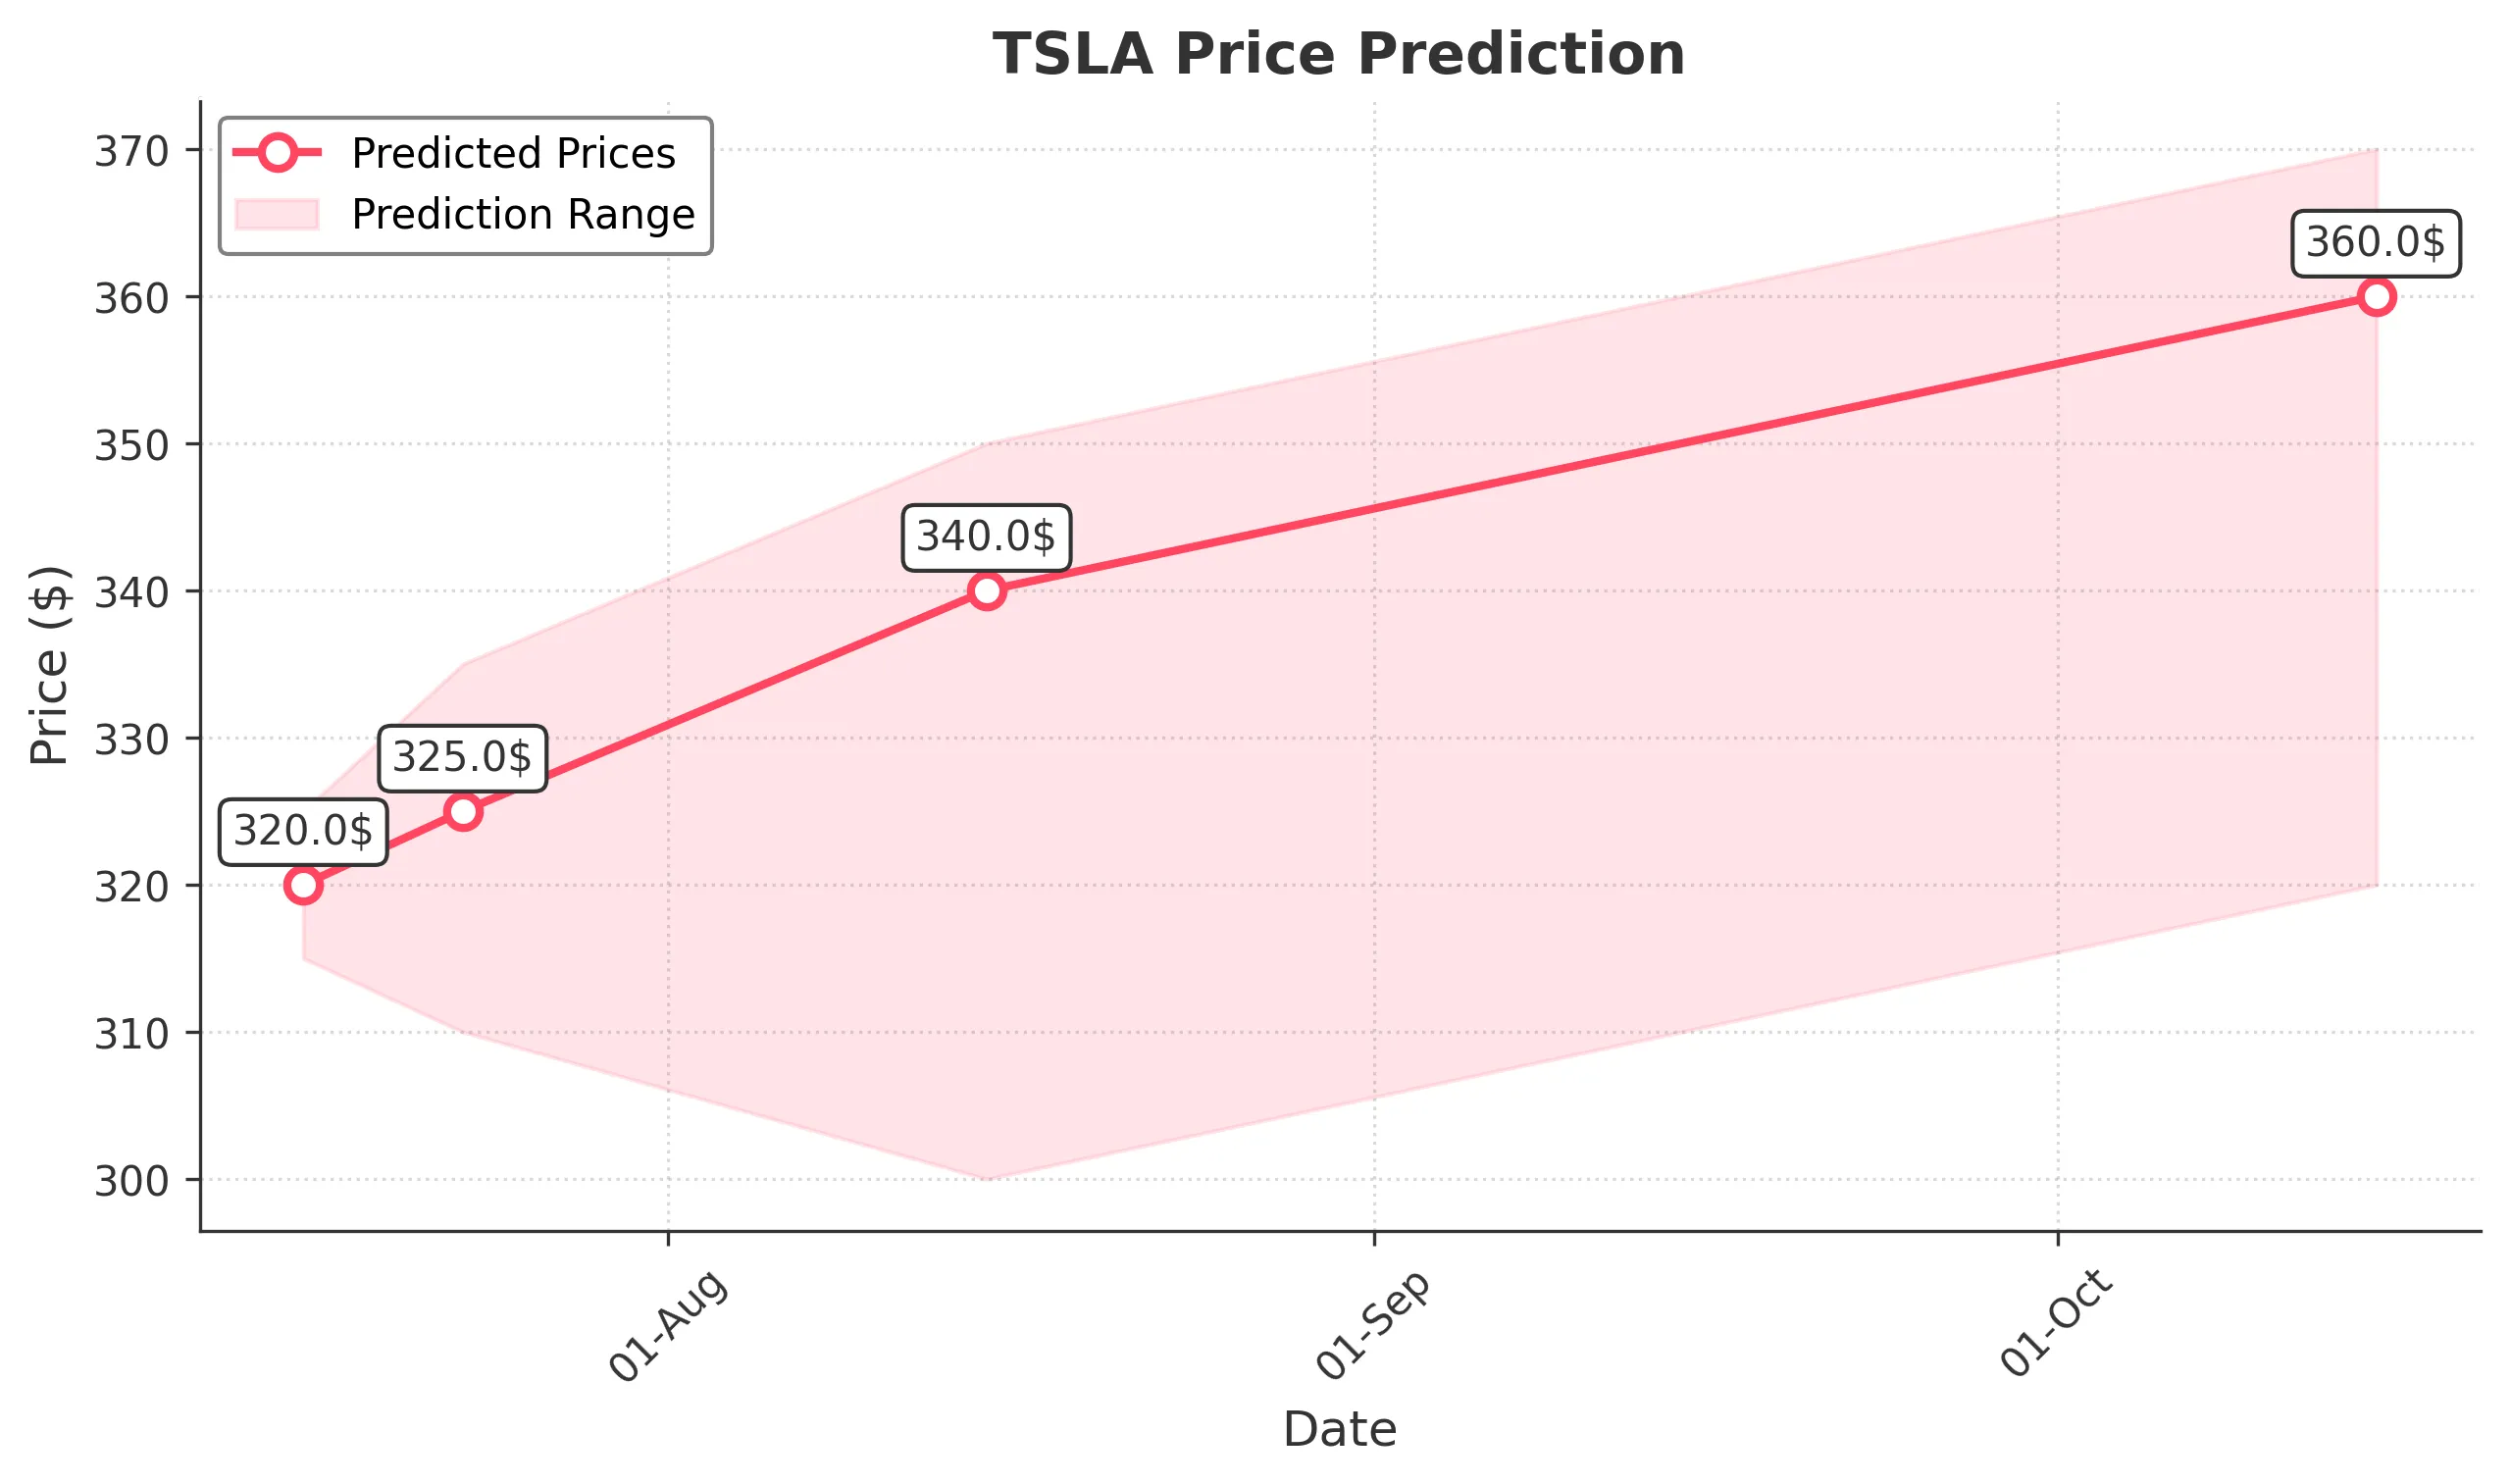
Target: July 16, 2025$320
$319
$325
$315
Description
The stock shows a slight bullish trend with a recent Doji candlestick indicating indecision. The RSI is neutral, and MACD is close to crossing above the signal line, suggesting potential upward momentum. However, volatility remains a concern.
Analysis
Over the past 3 months, TSLA has shown significant volatility, with a recent bullish trend peaking at $362.89. Key support is around $300, while resistance is near $350. Volume spikes indicate strong interest, but recent bearish patterns suggest caution.
Confidence Level
Potential Risks
Market sentiment could shift quickly due to external news or earnings reports, which may impact the prediction.
1 Week Prediction
Target: July 23, 2025$325
$320
$335
$310
Description
The stock is expected to consolidate around $325, with potential upward movement if it breaks resistance at $335. The Bollinger Bands indicate tightening, suggesting a breakout could occur. However, the RSI is nearing overbought territory.
Analysis
TSLA has experienced a mix of bullish and bearish trends, with significant price swings. The recent high of $362.89 and subsequent pullback indicate potential resistance. Volume analysis shows increased trading activity, suggesting strong interest.
Confidence Level
Potential Risks
A reversal could occur if market sentiment shifts negatively or if macroeconomic factors impact investor confidence.
1 Month Prediction
Target: August 15, 2025$340
$330
$350
$300
Description
Expect a gradual increase towards $340, supported by bullish momentum from recent price action. The MACD indicates a potential bullish crossover, while Fibonacci retracement levels suggest support at $300. Caution is advised due to market volatility.
Analysis
The stock has shown a bullish trend with significant price movements. Key support levels are around $300, while resistance is at $350. The RSI indicates a neutral position, and volume patterns suggest strong interest, but caution is warranted.
Confidence Level
Potential Risks
Unforeseen market events or earnings reports could lead to volatility, impacting the accuracy of this prediction.
3 Months Prediction
Target: October 15, 2025$360
$350
$370
$320
Description
Long-term outlook suggests a bullish trend towards $360, driven by strong fundamentals and market sentiment. The MACD and RSI indicate bullish momentum, but potential resistance at $370 could limit gains. Watch for macroeconomic influences.
Analysis
TSLA has shown a strong performance over the past 3 months, with significant price fluctuations. The stock is currently in a bullish phase, with key support at $320 and resistance at $370. Volume analysis indicates strong investor interest, but caution is advised.
Confidence Level
Potential Risks
Market conditions can change rapidly, and external factors may impact the stock's performance, leading to potential volatility.