TSLA Trading Predictions
1 Day Prediction
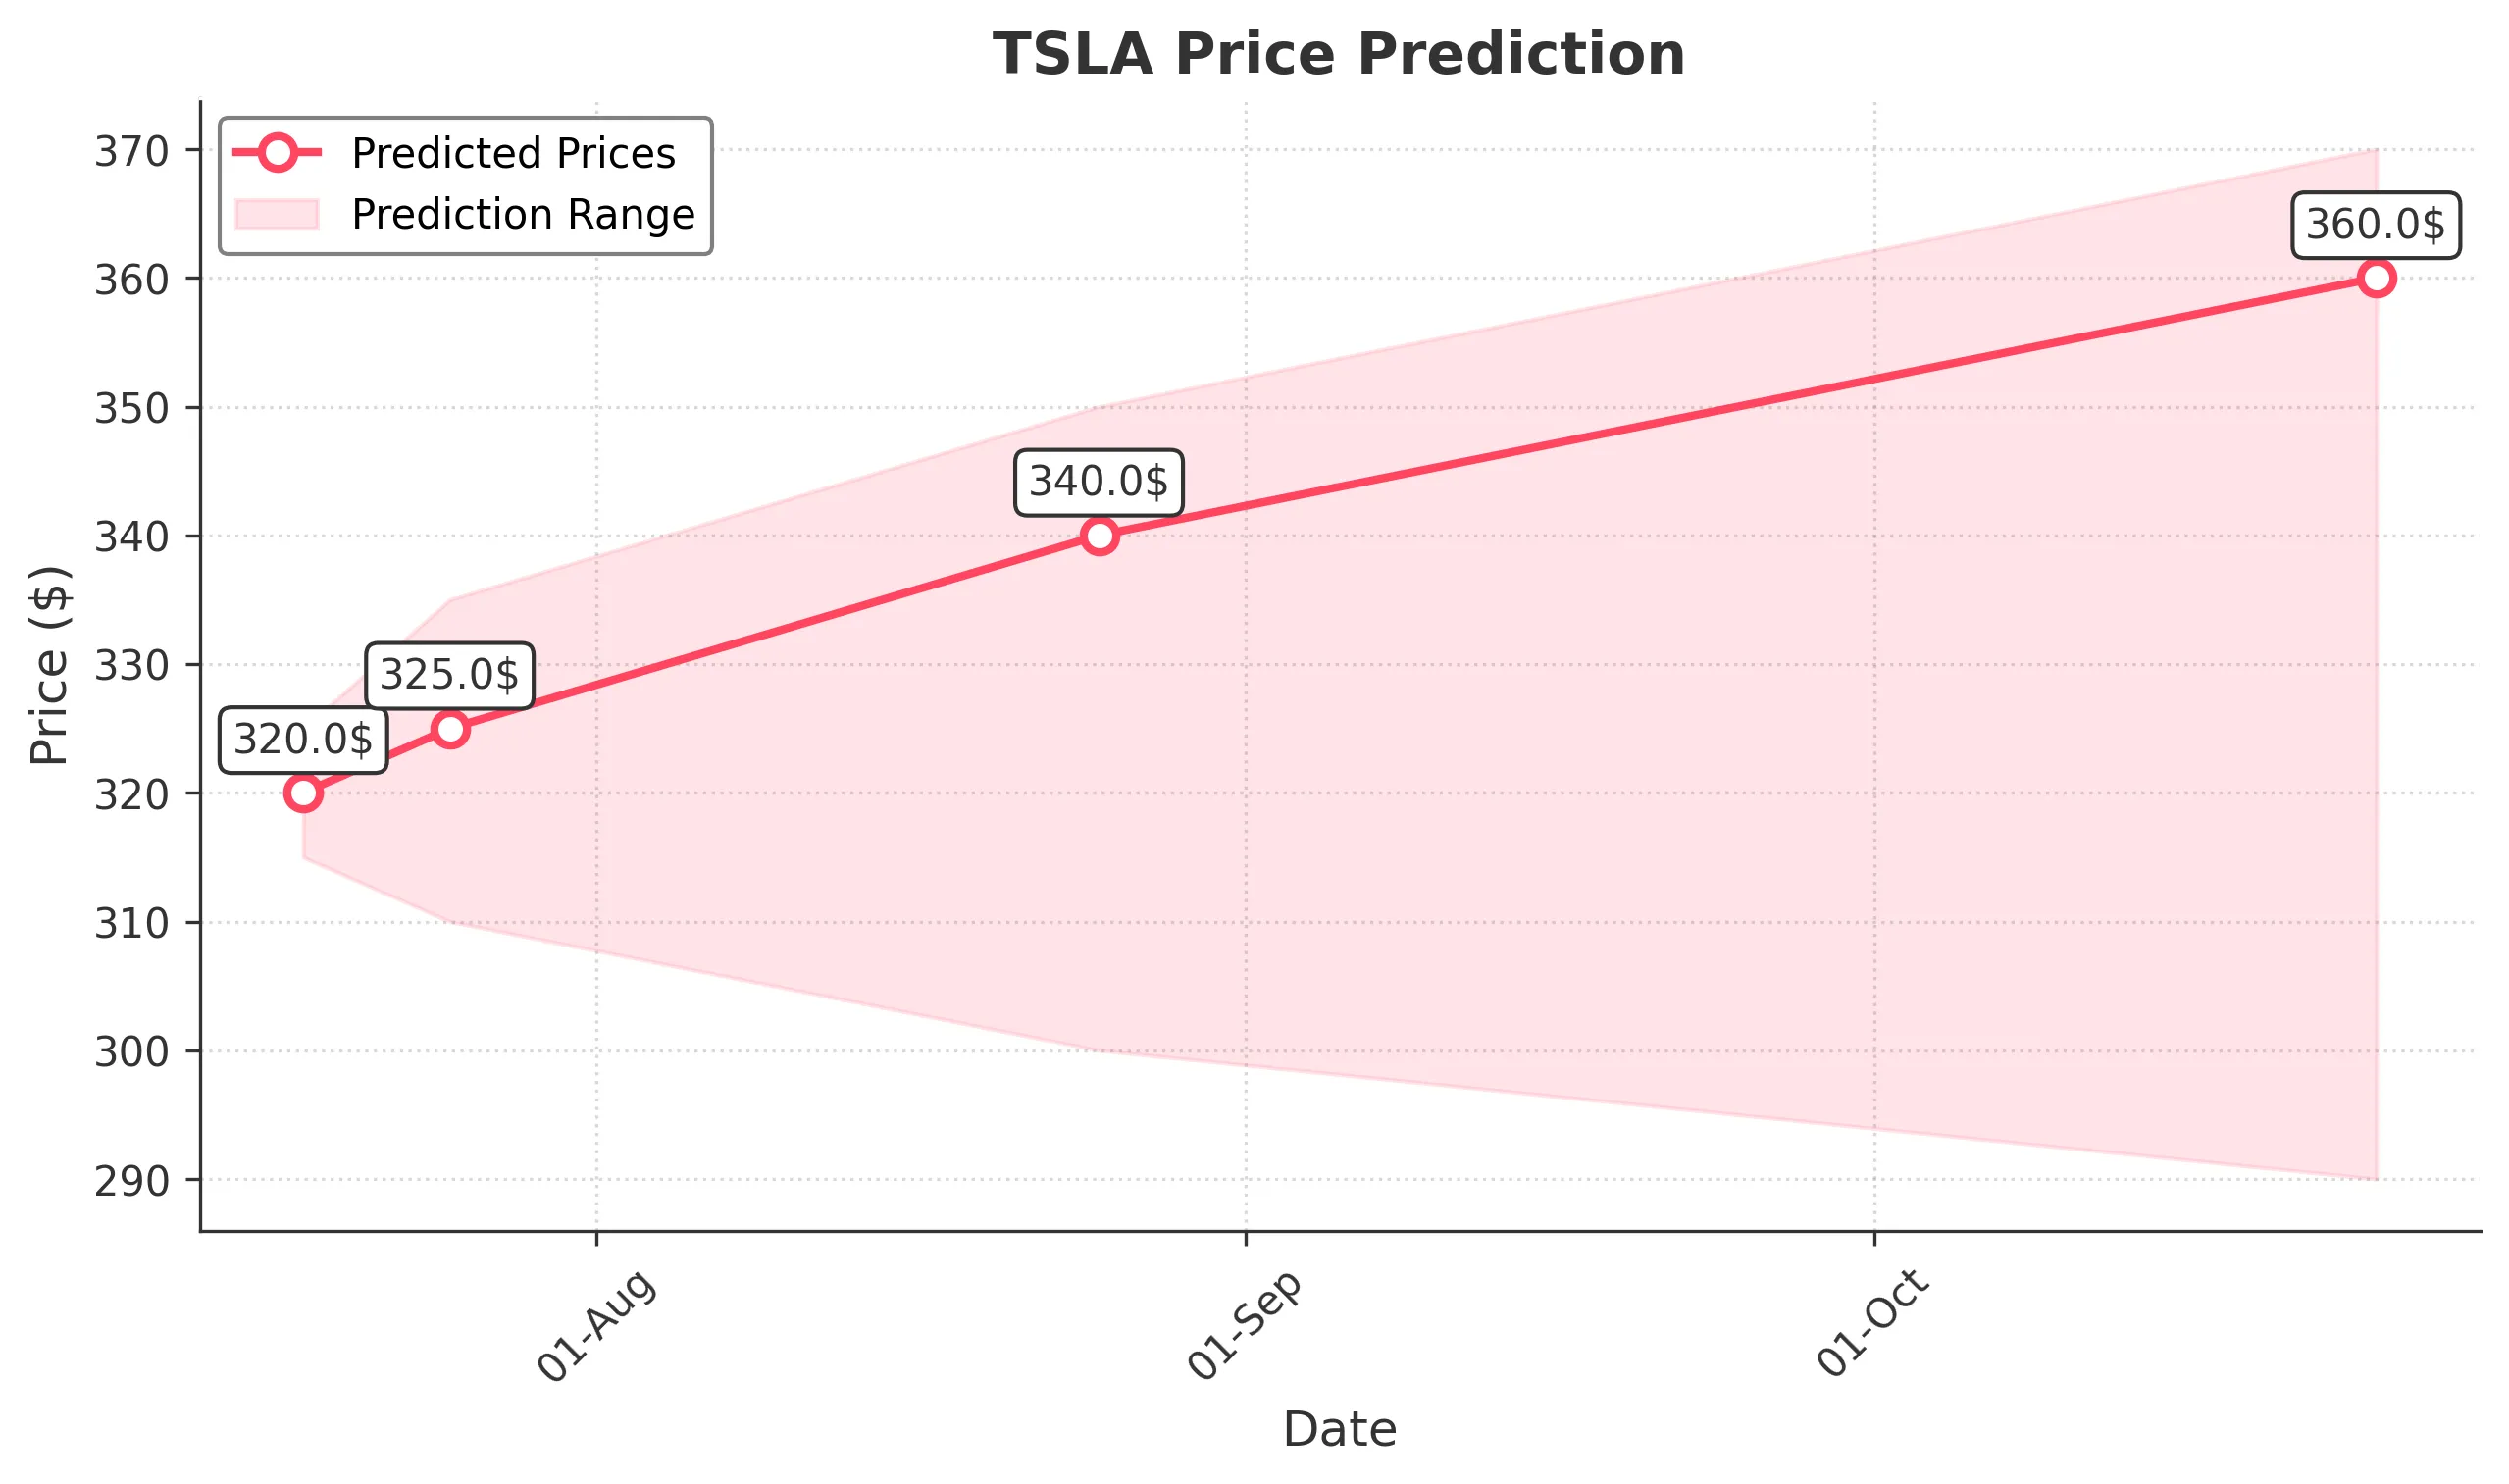
Target: July 18, 2025$320
$319
$325
$315
Description
The stock shows a slight bullish trend with a recent Doji candlestick indicating indecision. The RSI is neutral, and MACD is close to crossing above the signal line, suggesting potential upward momentum. However, volatility remains a concern.
Analysis
Over the past 3 months, TSLA has shown significant volatility with a recent bullish trend. Key support is around $300, while resistance is near $350. The RSI indicates a neutral position, and volume spikes suggest strong interest. Overall, the market sentiment is cautiously optimistic.
Confidence Level
Potential Risks
Market sentiment could shift quickly due to external news or earnings reports, which may impact the prediction.
1 Week Prediction
Target: July 25, 2025$325
$320
$335
$310
Description
The prediction reflects a potential upward movement as the stock approaches resistance levels. The MACD shows bullish divergence, and the Bollinger Bands indicate a squeeze, suggesting a breakout could occur. However, external factors may influence price.
Analysis
TSLA has experienced fluctuations with a recent bullish trend. Key support is at $310, while resistance is at $335. The RSI is approaching overbought territory, indicating caution. Volume patterns show increased interest, but volatility remains a concern.
Confidence Level
Potential Risks
Potential market corrections or negative news could lead to a downward reversal, impacting the accuracy of this prediction.
1 Month Prediction
Target: August 25, 2025$340
$330
$350
$300
Description
The stock is expected to trend upward as it breaks through resistance levels. The Fibonacci retracement levels suggest a target of $340. However, the RSI indicates potential overbought conditions, which could lead to corrections.
Analysis
In the last three months, TSLA has shown a bullish trend with significant price swings. Key support is at $300, while resistance is at $350. The MACD is bullish, but the RSI indicates overbought conditions. Volume patterns suggest strong interest, but caution is warranted.
Confidence Level
Potential Risks
Market volatility and external economic factors could lead to unexpected price movements, affecting the prediction's reliability.
3 Months Prediction
Target: October 25, 2025$360
$350
$370
$290
Description
The prediction anticipates continued upward momentum as the stock approaches new highs. The MACD remains bullish, and the overall market sentiment is positive. However, potential economic downturns could impact performance.
Analysis
TSLA has shown a strong bullish trend over the past three months, with key support at $290 and resistance at $370. The RSI is nearing overbought levels, indicating potential corrections. Volume patterns suggest strong interest, but external factors could introduce volatility.
Confidence Level
Potential Risks
Unforeseen macroeconomic events or changes in market sentiment could lead to significant price fluctuations, impacting the prediction's accuracy.