TSLA Trading Predictions
1 Day Prediction
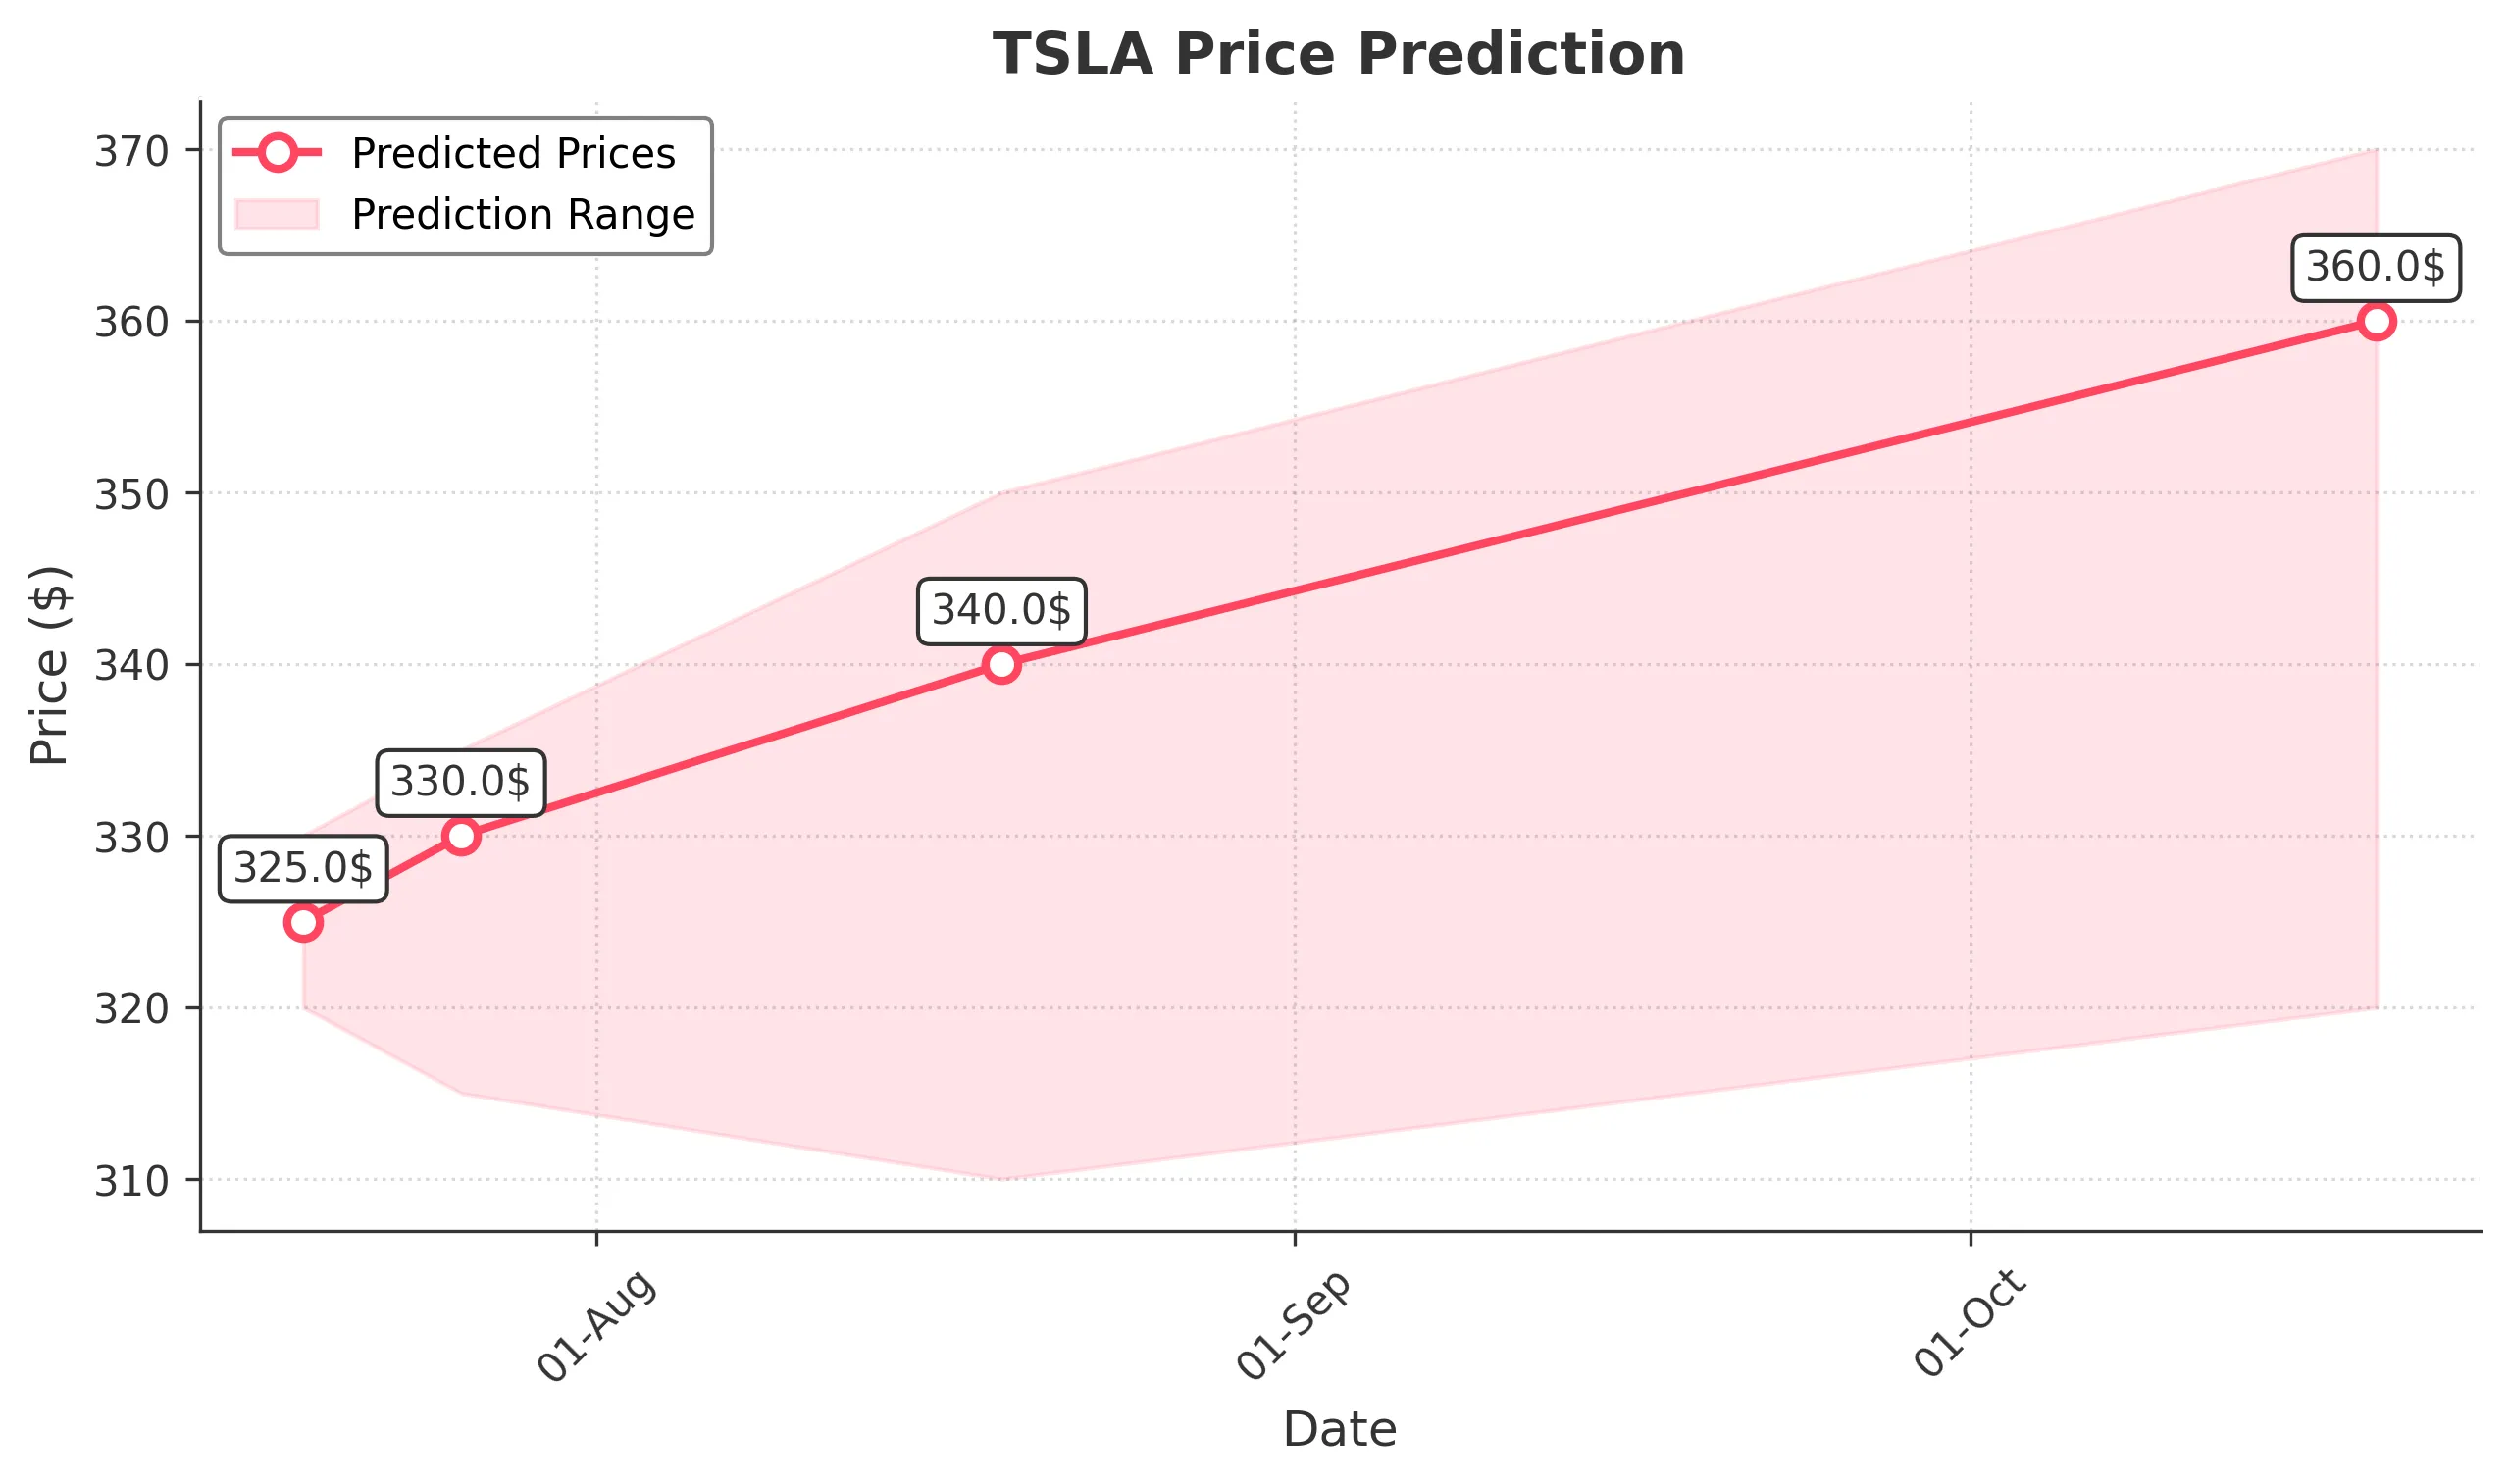
Target: July 19, 2025$325
$324
$330
$320
Description
The stock shows a bullish trend with a recent upward movement. The RSI is approaching overbought levels, indicating potential for a pullback. However, strong support at $320 and positive market sentiment may drive the price higher.
Analysis
Over the past 3 months, TSLA has shown significant volatility with a bullish trend, peaking at $362.89. Key support is at $320, while resistance is around $350. Volume spikes indicate strong interest, but recent RSI levels suggest caution.
Confidence Level
Potential Risks
Potential for a reversal exists if market sentiment shifts or if macroeconomic news impacts investor confidence.
1 Week Prediction
Target: July 26, 2025$330
$325
$335
$315
Description
The stock is expected to consolidate around $330, with potential for upward movement if bullish sentiment continues. However, the MACD shows signs of weakening momentum, suggesting caution.
Analysis
TSLA has experienced a strong rally but is now facing resistance around $350. The recent price action indicates a potential consolidation phase. Volume analysis shows healthy trading activity, but the RSI indicates overbought conditions.
Confidence Level
Potential Risks
Market volatility and external economic factors could lead to unexpected price movements.
1 Month Prediction
Target: August 19, 2025$340
$330
$350
$310
Description
Expect a gradual increase towards $340 as market sentiment remains positive. However, the potential for a pullback exists if the stock fails to break through resistance at $350.
Analysis
The stock has shown a bullish trend with significant price movements. Key support at $310 and resistance at $350 are critical. The MACD indicates potential upward momentum, but caution is advised due to overbought conditions.
Confidence Level
Potential Risks
Economic indicators and earnings reports could impact stock performance significantly.
3 Months Prediction
Target: October 19, 2025$360
$340
$370
$320
Description
Long-term outlook remains bullish with potential to reach $360. However, macroeconomic factors and earnings reports could introduce volatility.
Analysis
TSLA has shown strong performance over the past months, with key support at $320 and resistance at $350. The stock's volatility is high, and while the trend is bullish, external factors could impact future performance.
Confidence Level
Potential Risks
Unforeseen market events or economic downturns could lead to significant price corrections.