TSLA Trading Predictions
1 Day Prediction
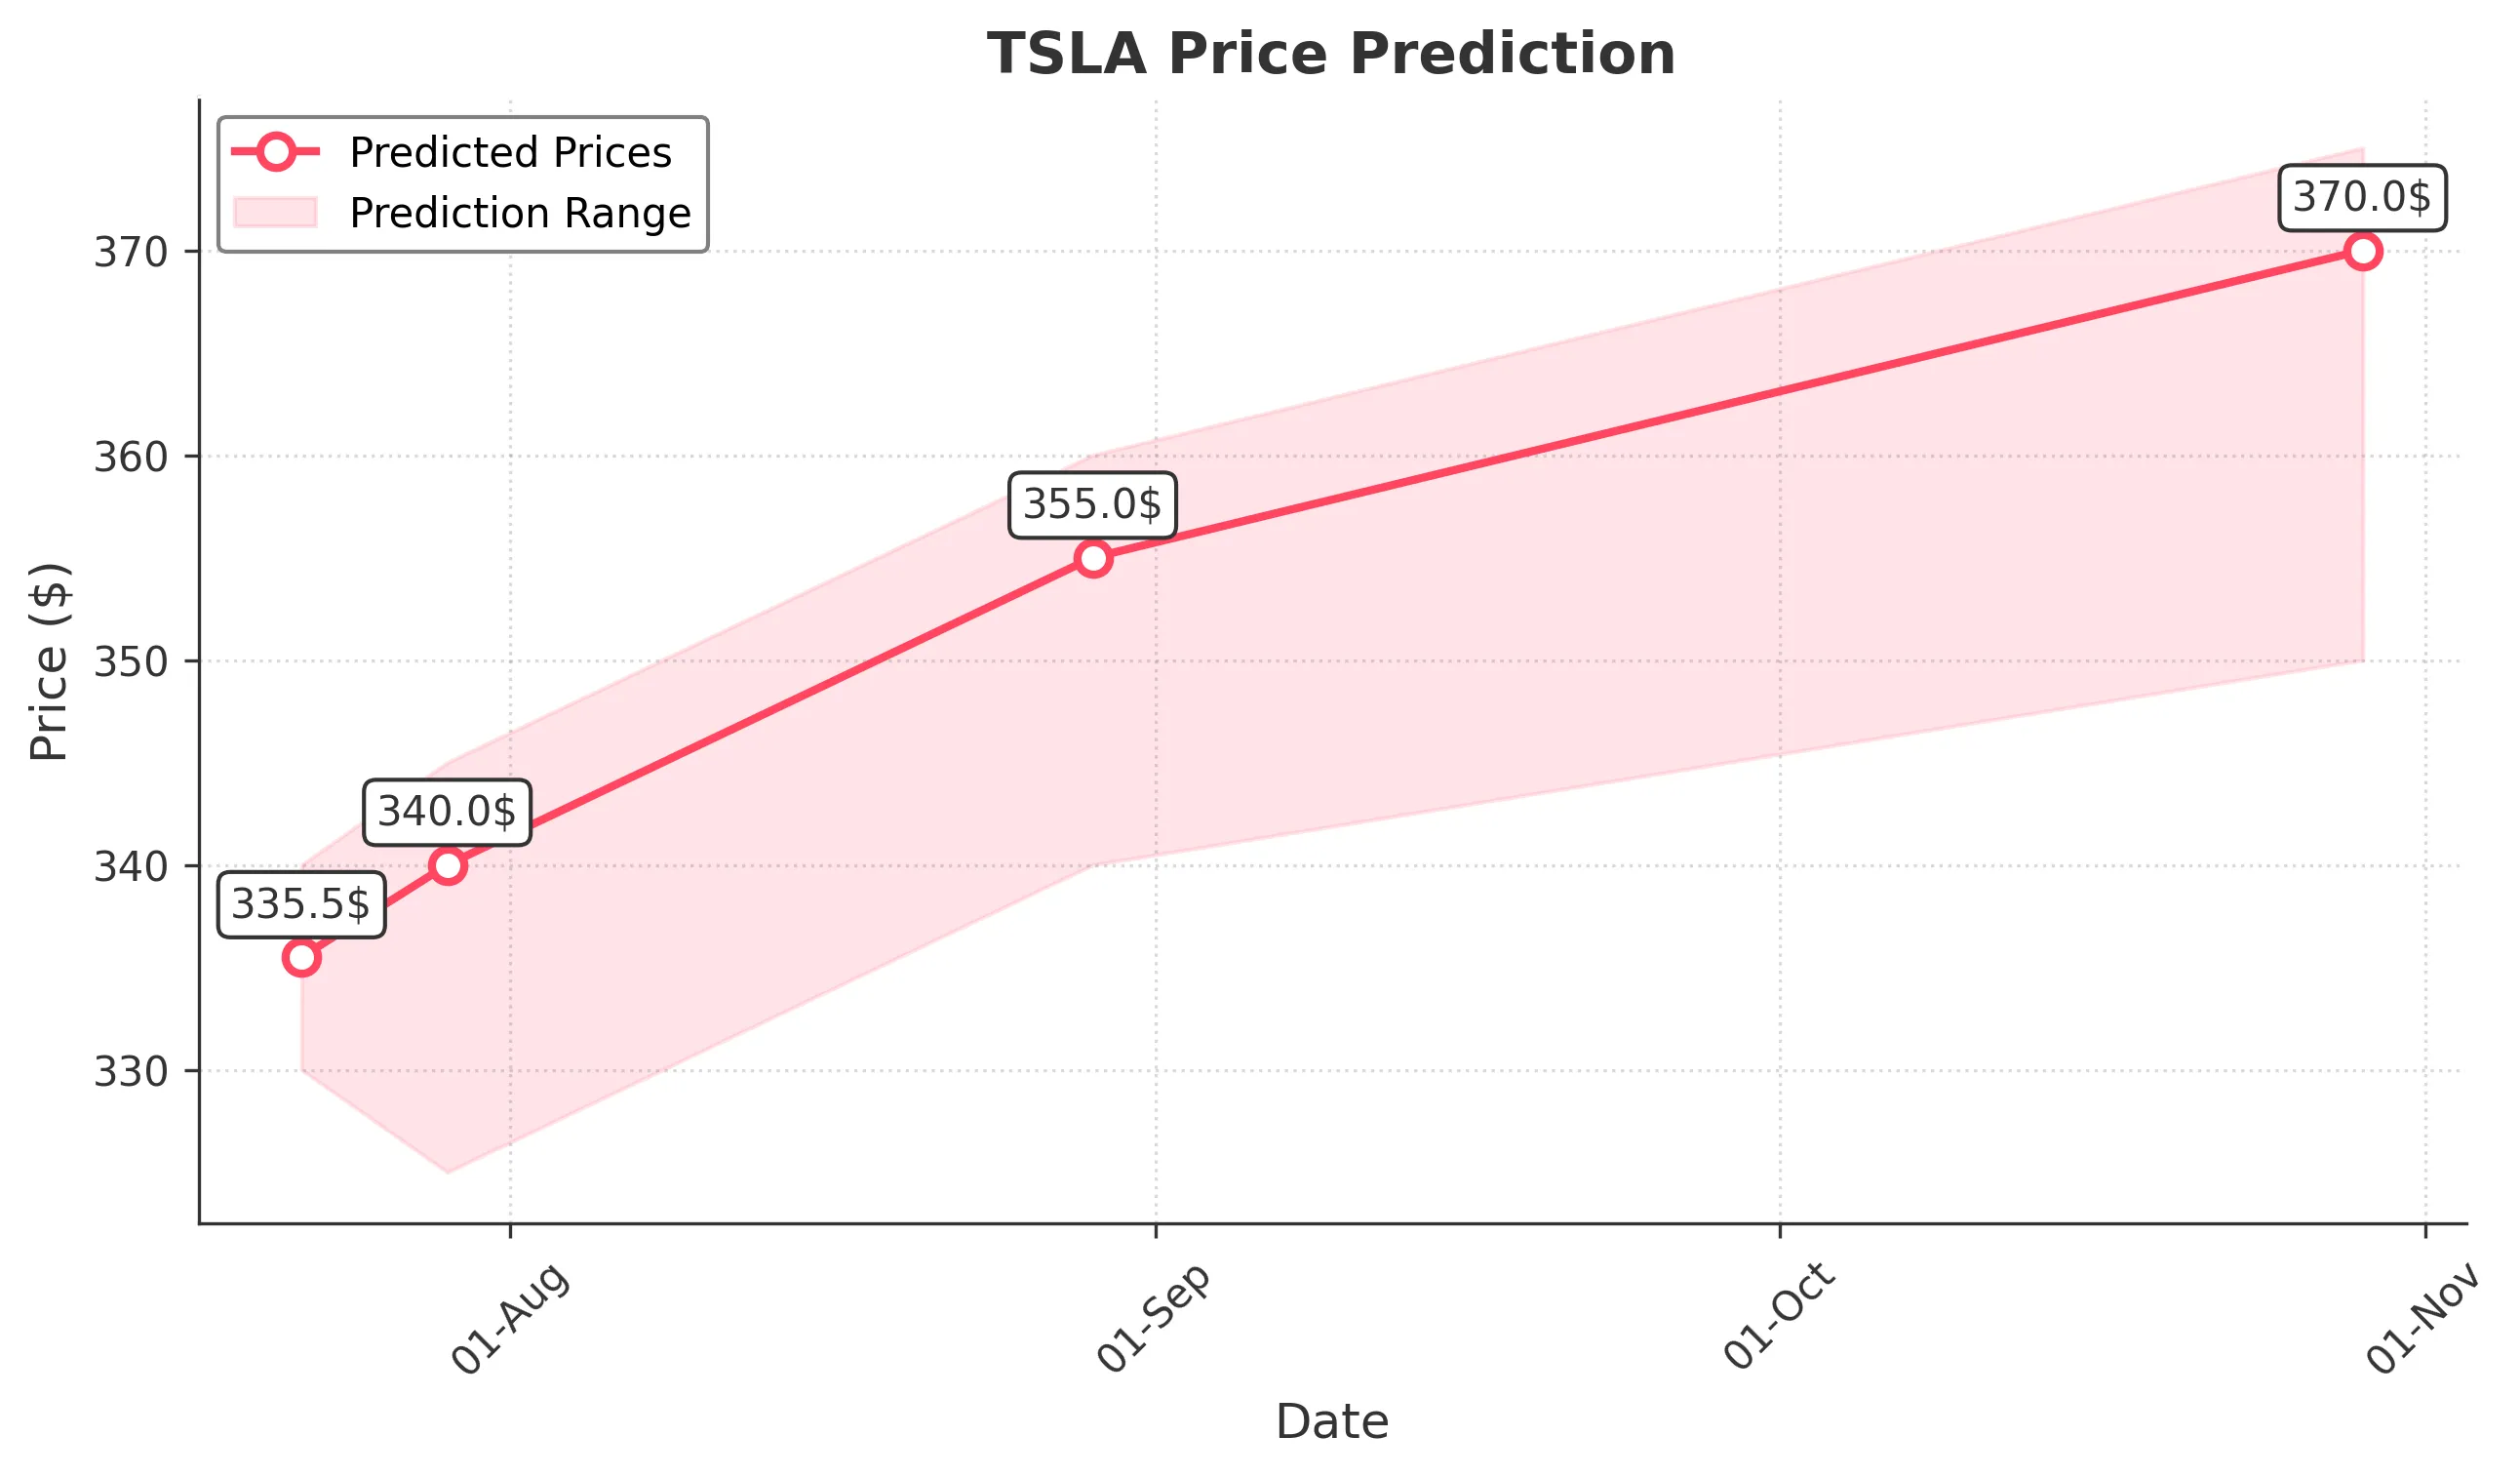
Target: July 22, 2025$335.5
$332
$340
$330
Description
The stock shows bullish momentum with a recent upward trend. The RSI is approaching overbought levels, indicating potential for a pullback. However, strong volume suggests continued interest. Expect a close around 335.50.
Analysis
TSLA has shown a bullish trend over the past three months, with significant support at 310 and resistance around 350. Recent volume spikes indicate strong buying interest, but the RSI suggests caution as it nears overbought territory.
Confidence Level
Potential Risks
Potential for a pullback due to overbought RSI and market volatility.
1 Week Prediction
Target: July 29, 2025$340
$335
$345
$325
Description
The stock is expected to maintain its upward trajectory, supported by recent bullish candlestick patterns. However, the potential for profit-taking may lead to volatility. Anticipate a close around 340.00.
Analysis
The stock has been in a bullish phase, with key support at 320 and resistance at 350. The MACD shows bullish momentum, but the ATR indicates increasing volatility, suggesting caution for short-term traders.
Confidence Level
Potential Risks
Market sentiment could shift, leading to unexpected volatility.
1 Month Prediction
Target: August 29, 2025$355
$350
$360
$340
Description
Expect continued bullish momentum as the stock approaches key Fibonacci retracement levels. However, the RSI indicates potential overbought conditions, which could lead to corrections. Close around 355.00.
Analysis
TSLA has shown strong performance with a bullish trend. Key support is at 340, while resistance is at 360. The MACD is bullish, but the RSI suggests caution as it nears overbought levels, indicating potential for a pullback.
Confidence Level
Potential Risks
Market corrections could occur if profit-taking intensifies.
3 Months Prediction
Target: October 29, 2025$370
$360
$375
$350
Description
Long-term bullish sentiment remains strong, supported by positive market trends and strong fundamentals. However, external economic factors could introduce volatility. Expect a close around 370.00.
Analysis
Over the past three months, TSLA has shown a bullish trend with significant support at 340 and resistance at 375. The stock's performance is influenced by broader market conditions and potential economic shifts, which could introduce uncertainty.
Confidence Level
Potential Risks
Macroeconomic events and market sentiment shifts could impact performance.