TSLA Trading Predictions
1 Day Prediction
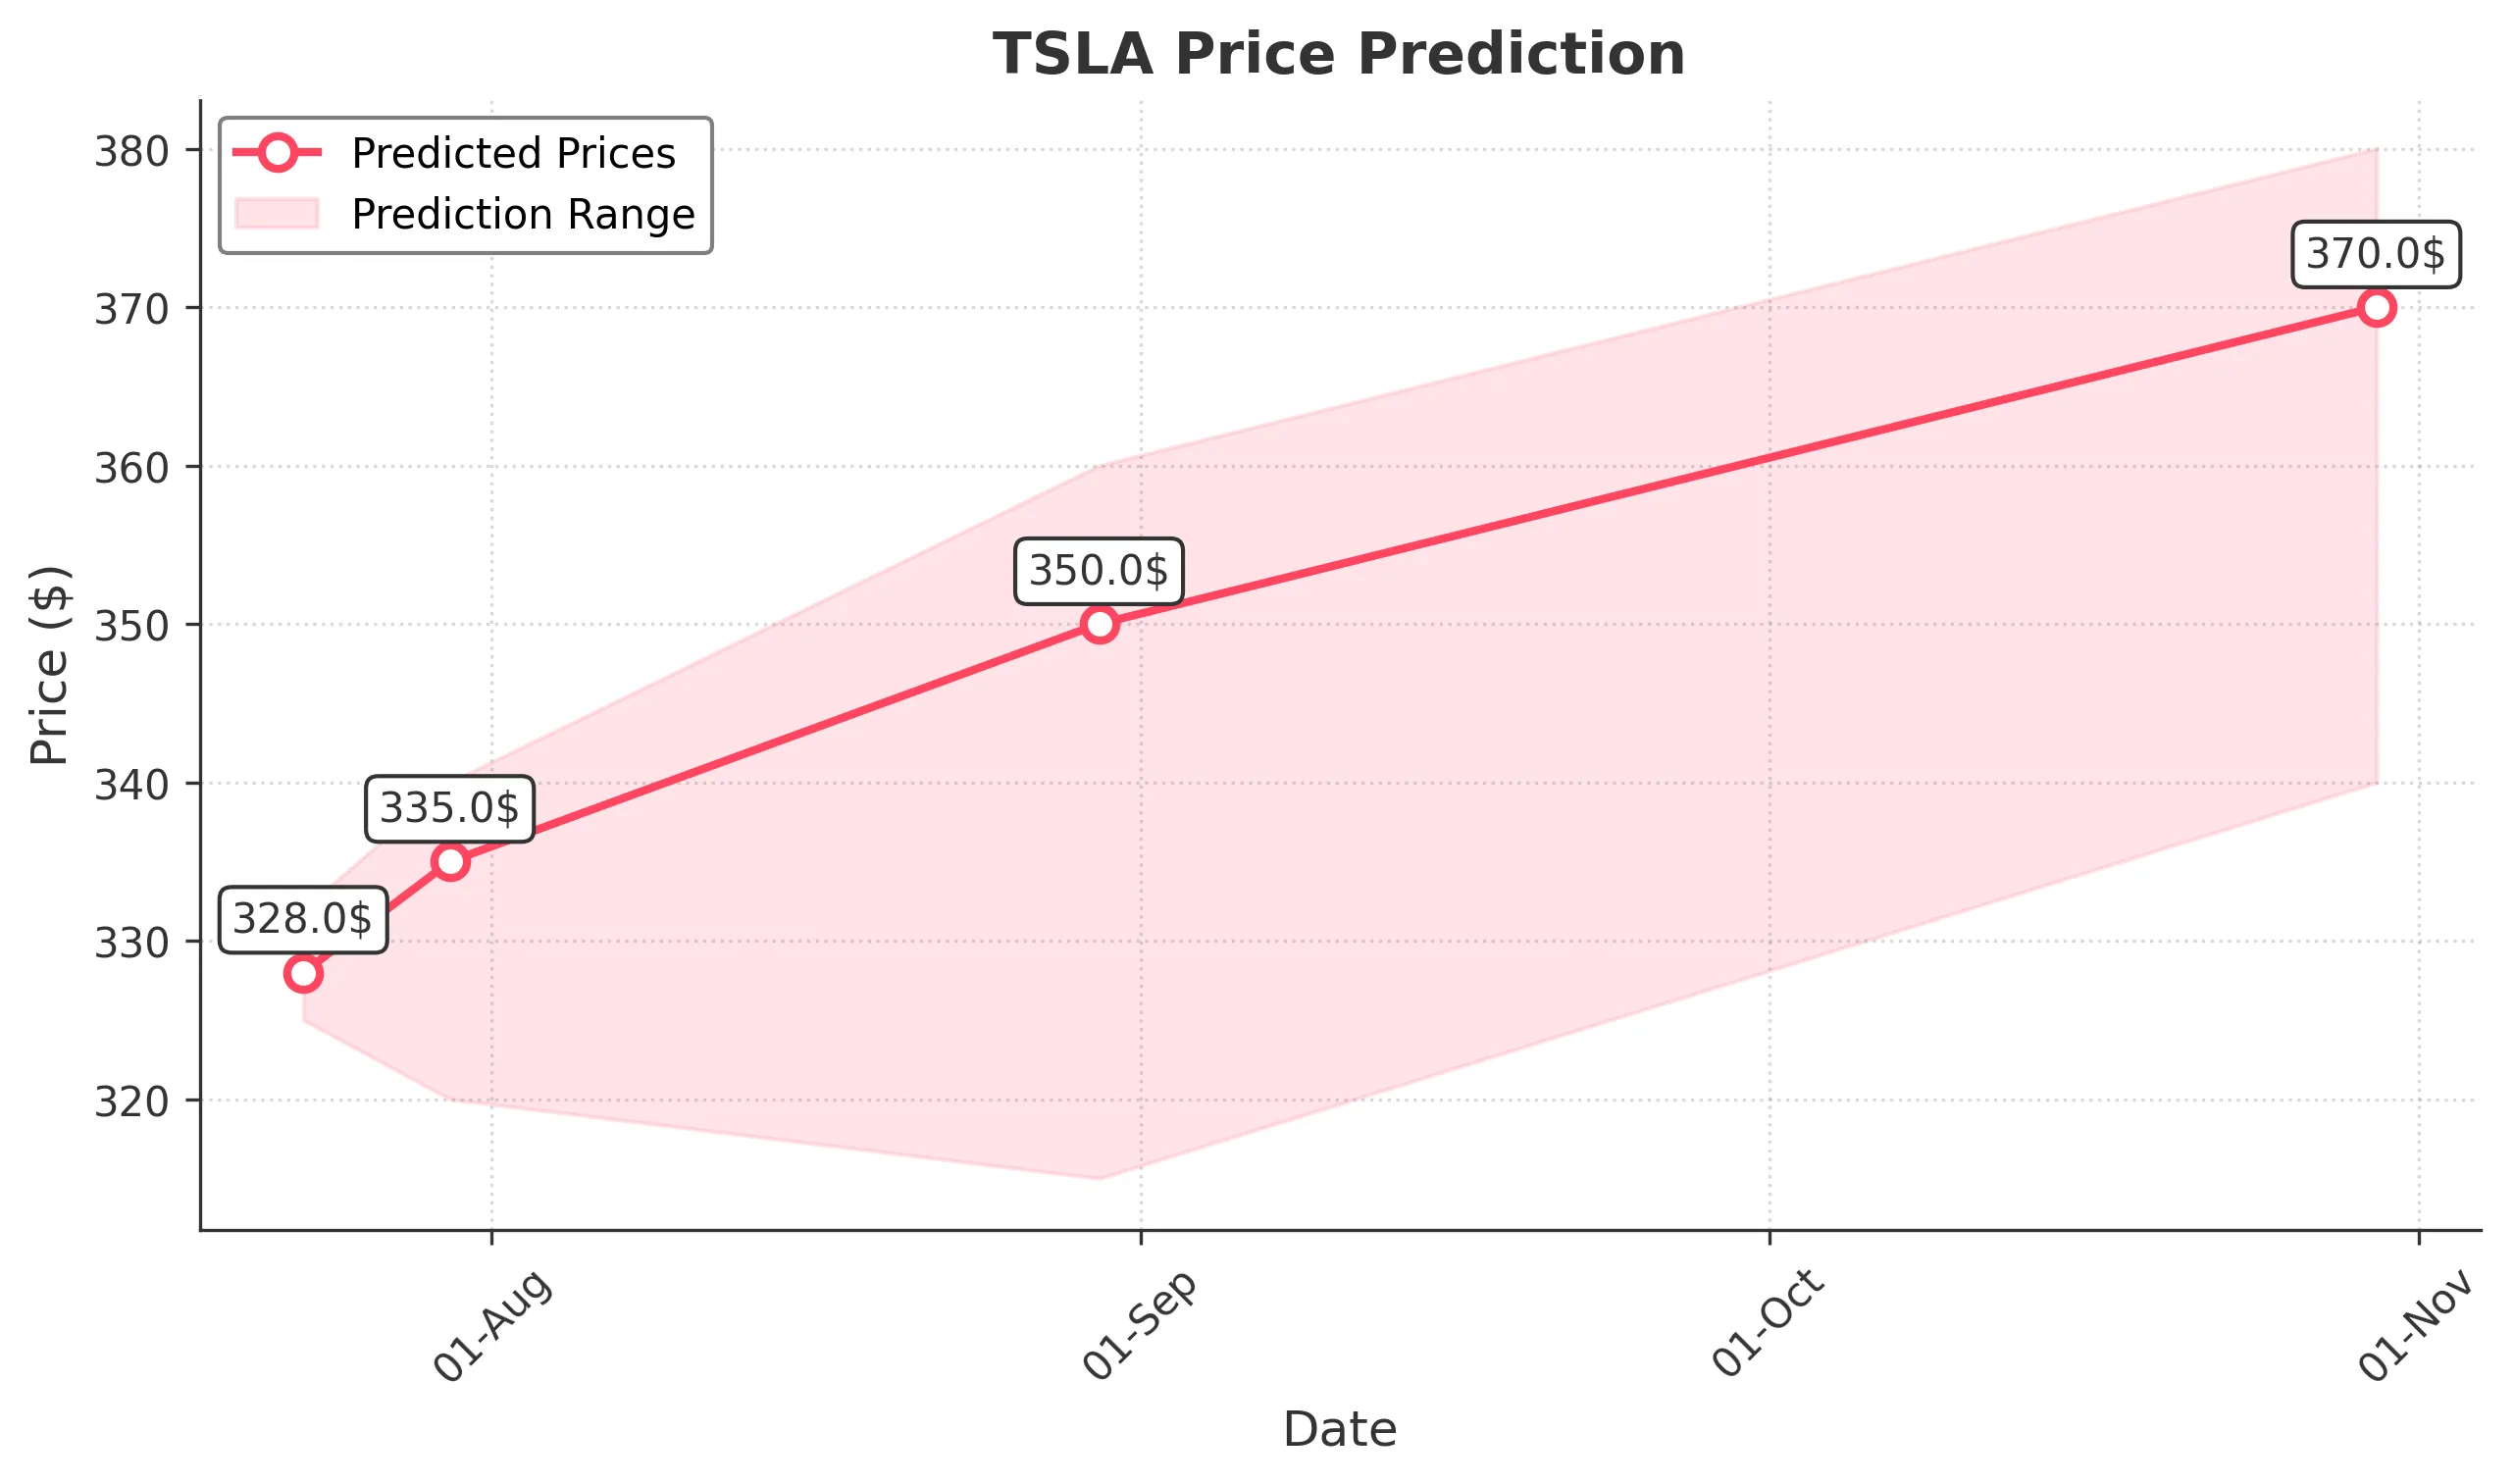
Target: July 23, 2025$328
$327.5
$332
$325
Description
The stock shows a slight bullish trend with a recent Doji pattern indicating indecision. RSI is neutral, and MACD is close to crossing above the signal line, suggesting potential upward momentum. However, recent volatility may lead to fluctuations.
Analysis
Over the past 3 months, TSLA has shown a bullish trend with significant price increases, reaching highs around 362.89. Key support is at 300, while resistance is near 350. Volume spikes indicate strong interest, but recent volatility raises concerns about potential pullbacks.
Confidence Level
Potential Risks
Market sentiment could shift due to external news or earnings reports, which may impact the stock's performance.
1 Week Prediction
Target: July 30, 2025$335
$330
$340
$320
Description
The stock is expected to consolidate around current levels with potential upward movement. The MACD indicates bullish momentum, while the RSI is approaching overbought territory. Watch for any bearish divergence that could signal a reversal.
Analysis
TSLA has experienced significant volatility, with recent highs and lows indicating a strong trading range. The stock's performance has been influenced by macroeconomic factors, including interest rates and market sentiment, which remain mixed.
Confidence Level
Potential Risks
Potential market corrections or negative news could lead to a decline, especially if the RSI indicates overbought conditions.
1 Month Prediction
Target: August 30, 2025$350
$340
$360
$315
Description
Expect a gradual increase in price as bullish sentiment builds. The 50-day moving average is trending upwards, and the stock is likely to test resistance at 360. However, watch for any signs of exhaustion in the rally.
Analysis
The stock has shown a strong upward trend, with significant support at 320. The recent price action suggests bullish sentiment, but the market remains sensitive to external factors, including economic data and competitive pressures.
Confidence Level
Potential Risks
Economic indicators or earnings reports could impact the stock's trajectory, leading to unexpected volatility.
3 Months Prediction
Target: October 30, 2025$370
$360
$380
$340
Description
Long-term bullish outlook as the stock may break through resistance levels. The MACD and RSI suggest continued upward momentum, but potential market corrections could occur. Monitor for any significant news that could alter sentiment.
Analysis
TSLA's performance over the past three months has been characterized by strong bullish trends, with significant price increases. Key resistance levels are being tested, and while the outlook remains positive, external factors could introduce volatility.
Confidence Level
Potential Risks
Unforeseen market events or changes in consumer sentiment could lead to volatility and affect the stock's performance.