TSLA Trading Predictions
1 Day Prediction
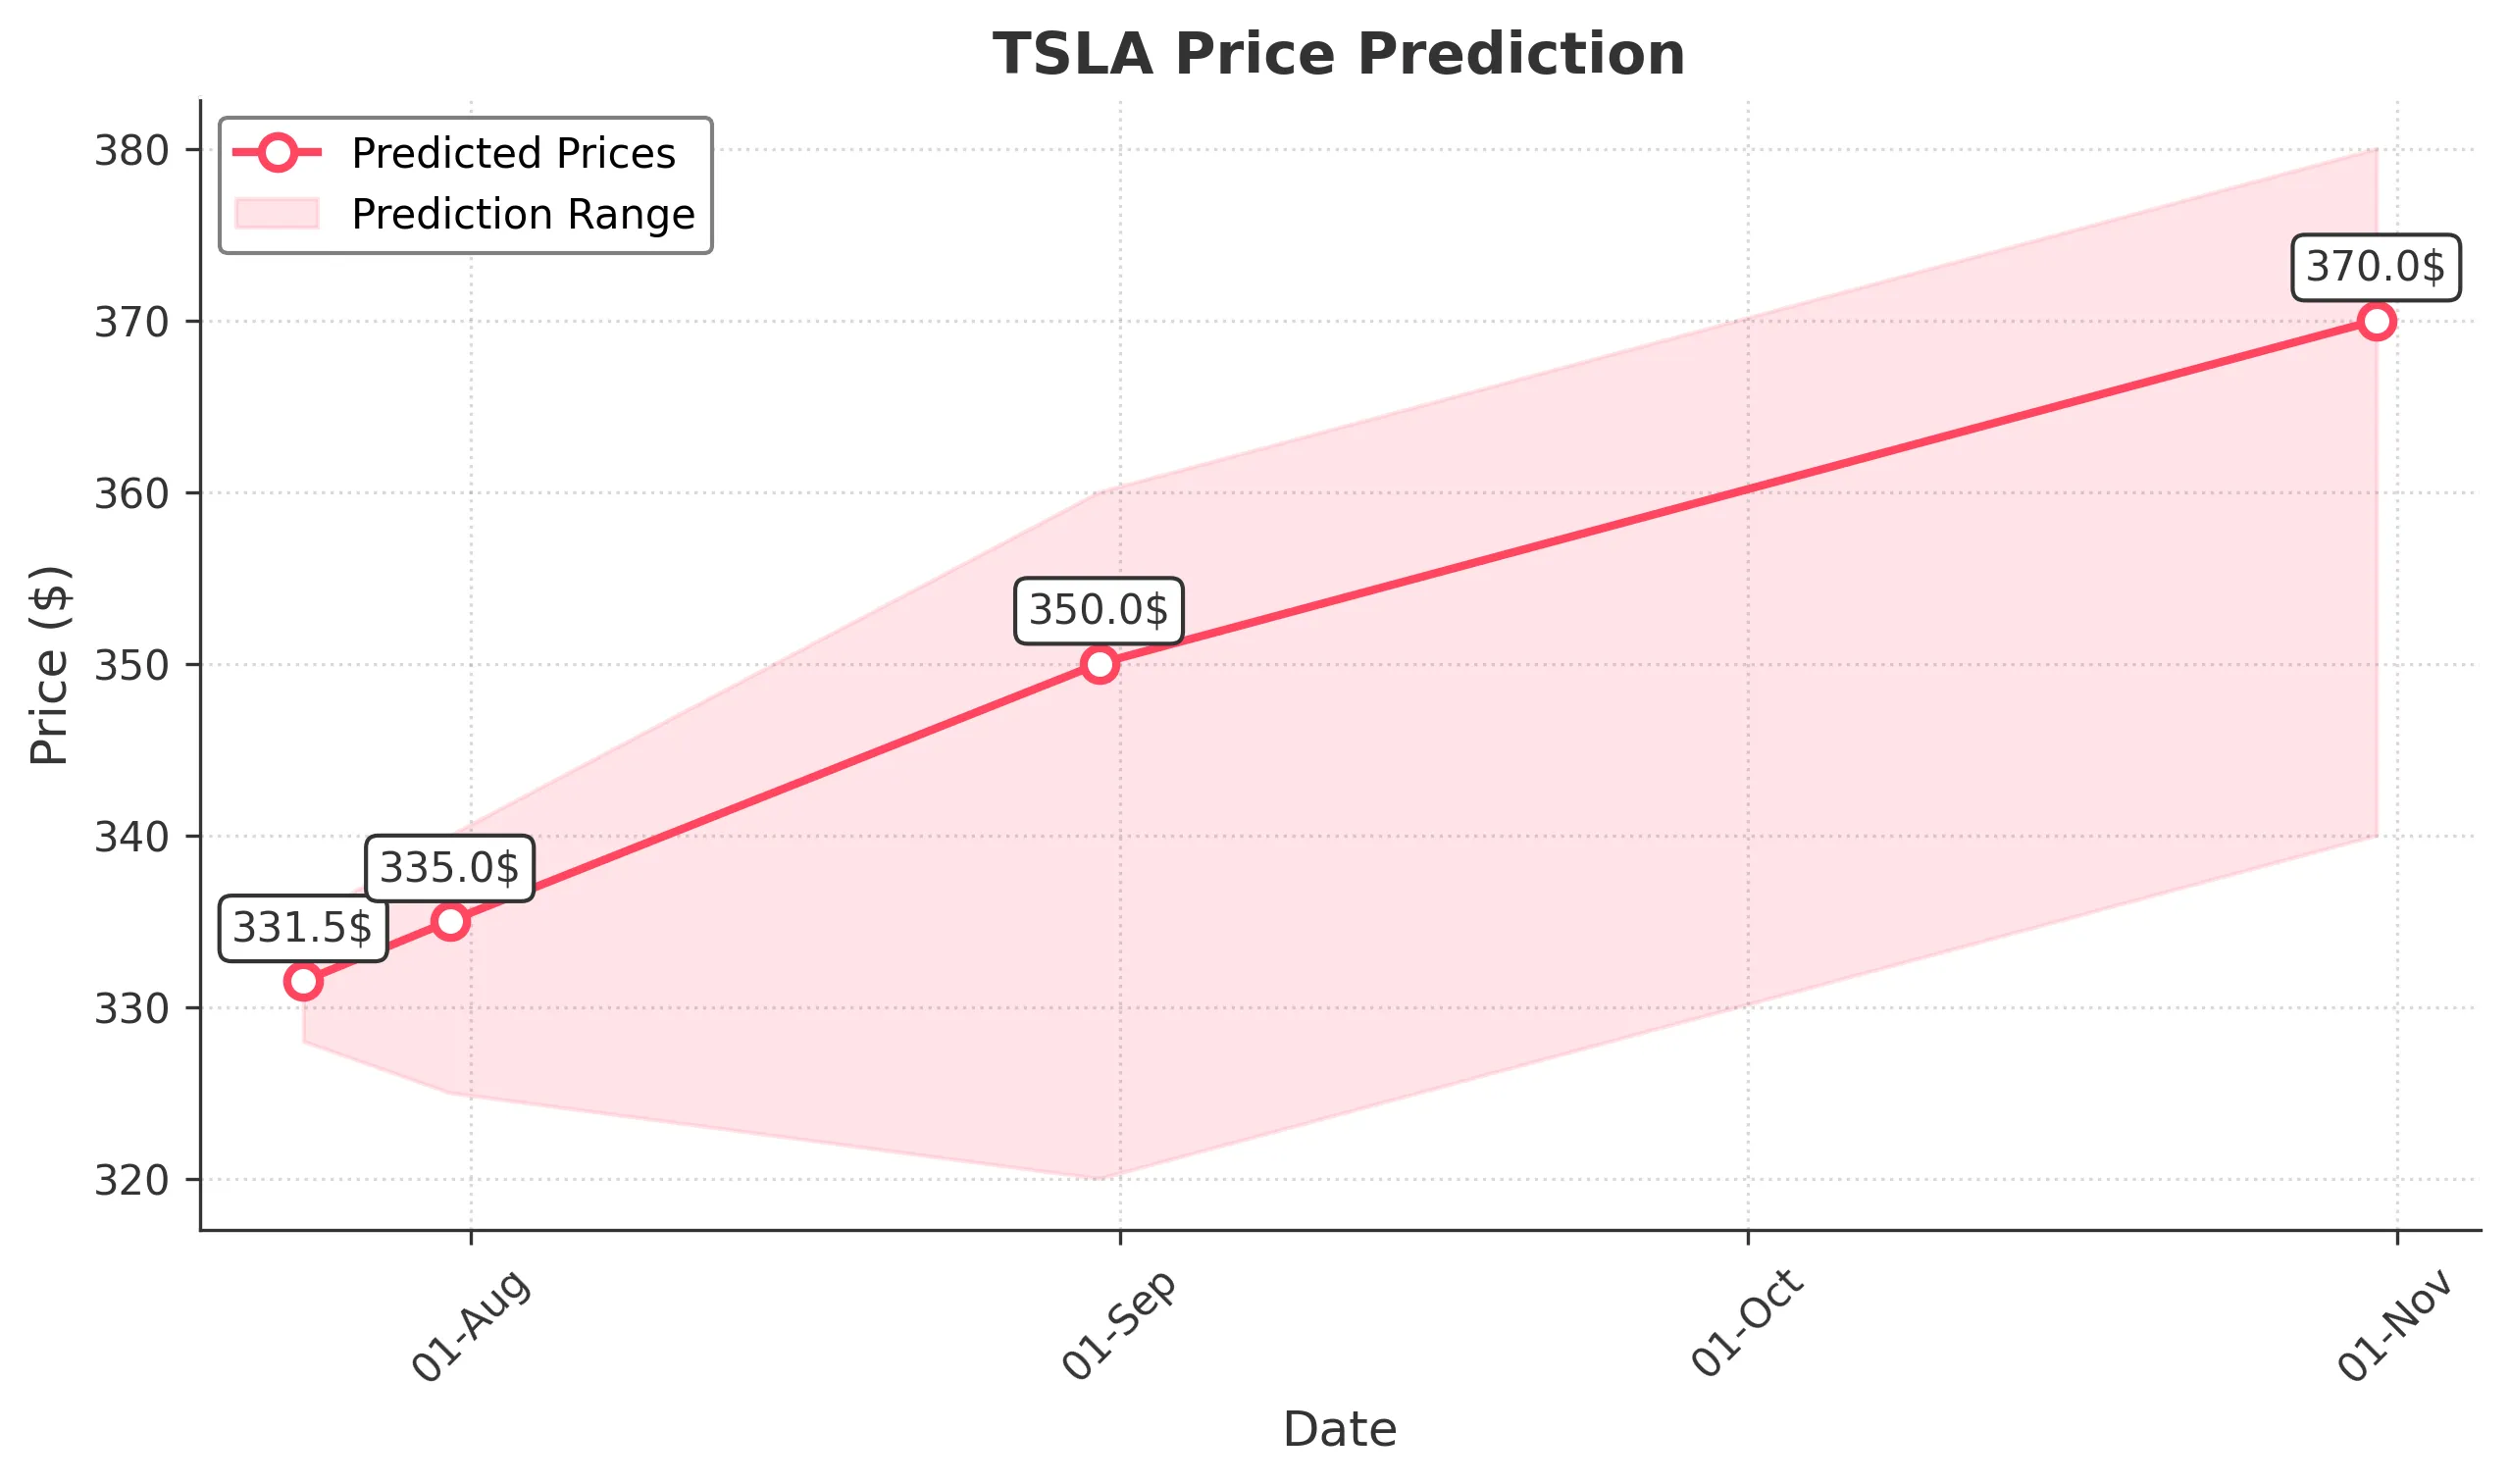
Target: July 24, 2025$331.5
$330
$335
$328
Description
The stock shows a slight bullish trend with a recent Doji candlestick indicating indecision. The RSI is near 60, suggesting room for upward movement. However, MACD is flattening, indicating potential resistance ahead.
Analysis
Over the past 3 months, TSLA has shown a bullish trend with significant price increases, peaking at $358. The recent pullback suggests a consolidation phase. Key support is around $320, while resistance is near $350. Volume has been inconsistent, indicating mixed market sentiment.
Confidence Level
Potential Risks
Market volatility and external news could impact the price. A bearish reversal is possible if the stock fails to break above recent highs.
1 Week Prediction
Target: July 31, 2025$335
$330
$340
$325
Description
The stock is expected to continue its upward momentum, supported by a bullish MACD crossover. However, the RSI nearing overbought levels suggests caution. A breakout above $340 could lead to further gains.
Analysis
TSLA has been in a bullish phase, with strong buying interest pushing prices higher. Key resistance at $340 has been tested, and a breakout could lead to new highs. However, the recent increase in volatility raises concerns about potential pullbacks.
Confidence Level
Potential Risks
Potential market corrections or negative news could reverse the trend. Watch for volume spikes that may indicate a shift in sentiment.
1 Month Prediction
Target: August 31, 2025$350
$335
$360
$320
Description
Expect continued bullish momentum as the stock approaches key Fibonacci retracement levels. The MACD remains positive, but RSI indicates potential overbought conditions. A pullback could occur if resistance at $360 holds.
Analysis
The stock has shown strong performance, with significant gains over the past months. Key support is at $320, while resistance is at $360. The overall trend remains bullish, but caution is warranted as the stock approaches overbought territory.
Confidence Level
Potential Risks
Market sentiment can shift quickly, and external factors such as earnings reports or economic data could impact performance. Watch for signs of exhaustion in the rally.
3 Months Prediction
Target: October 31, 2025$370
$355
$380
$340
Description
Long-term bullish outlook as TSLA continues to gain traction. The stock is expected to test higher resistance levels, supported by strong fundamentals. However, watch for potential corrections as the market adjusts.
Analysis
TSLA has demonstrated resilience and growth potential, with key support at $340 and resistance at $380. The overall trend remains bullish, but external factors could introduce volatility. Investors should remain vigilant for signs of market shifts.
Confidence Level
Potential Risks
Economic conditions and competitive pressures could impact growth. A significant market downturn could also affect TSLA's performance.