TSLA Trading Predictions
1 Day Prediction
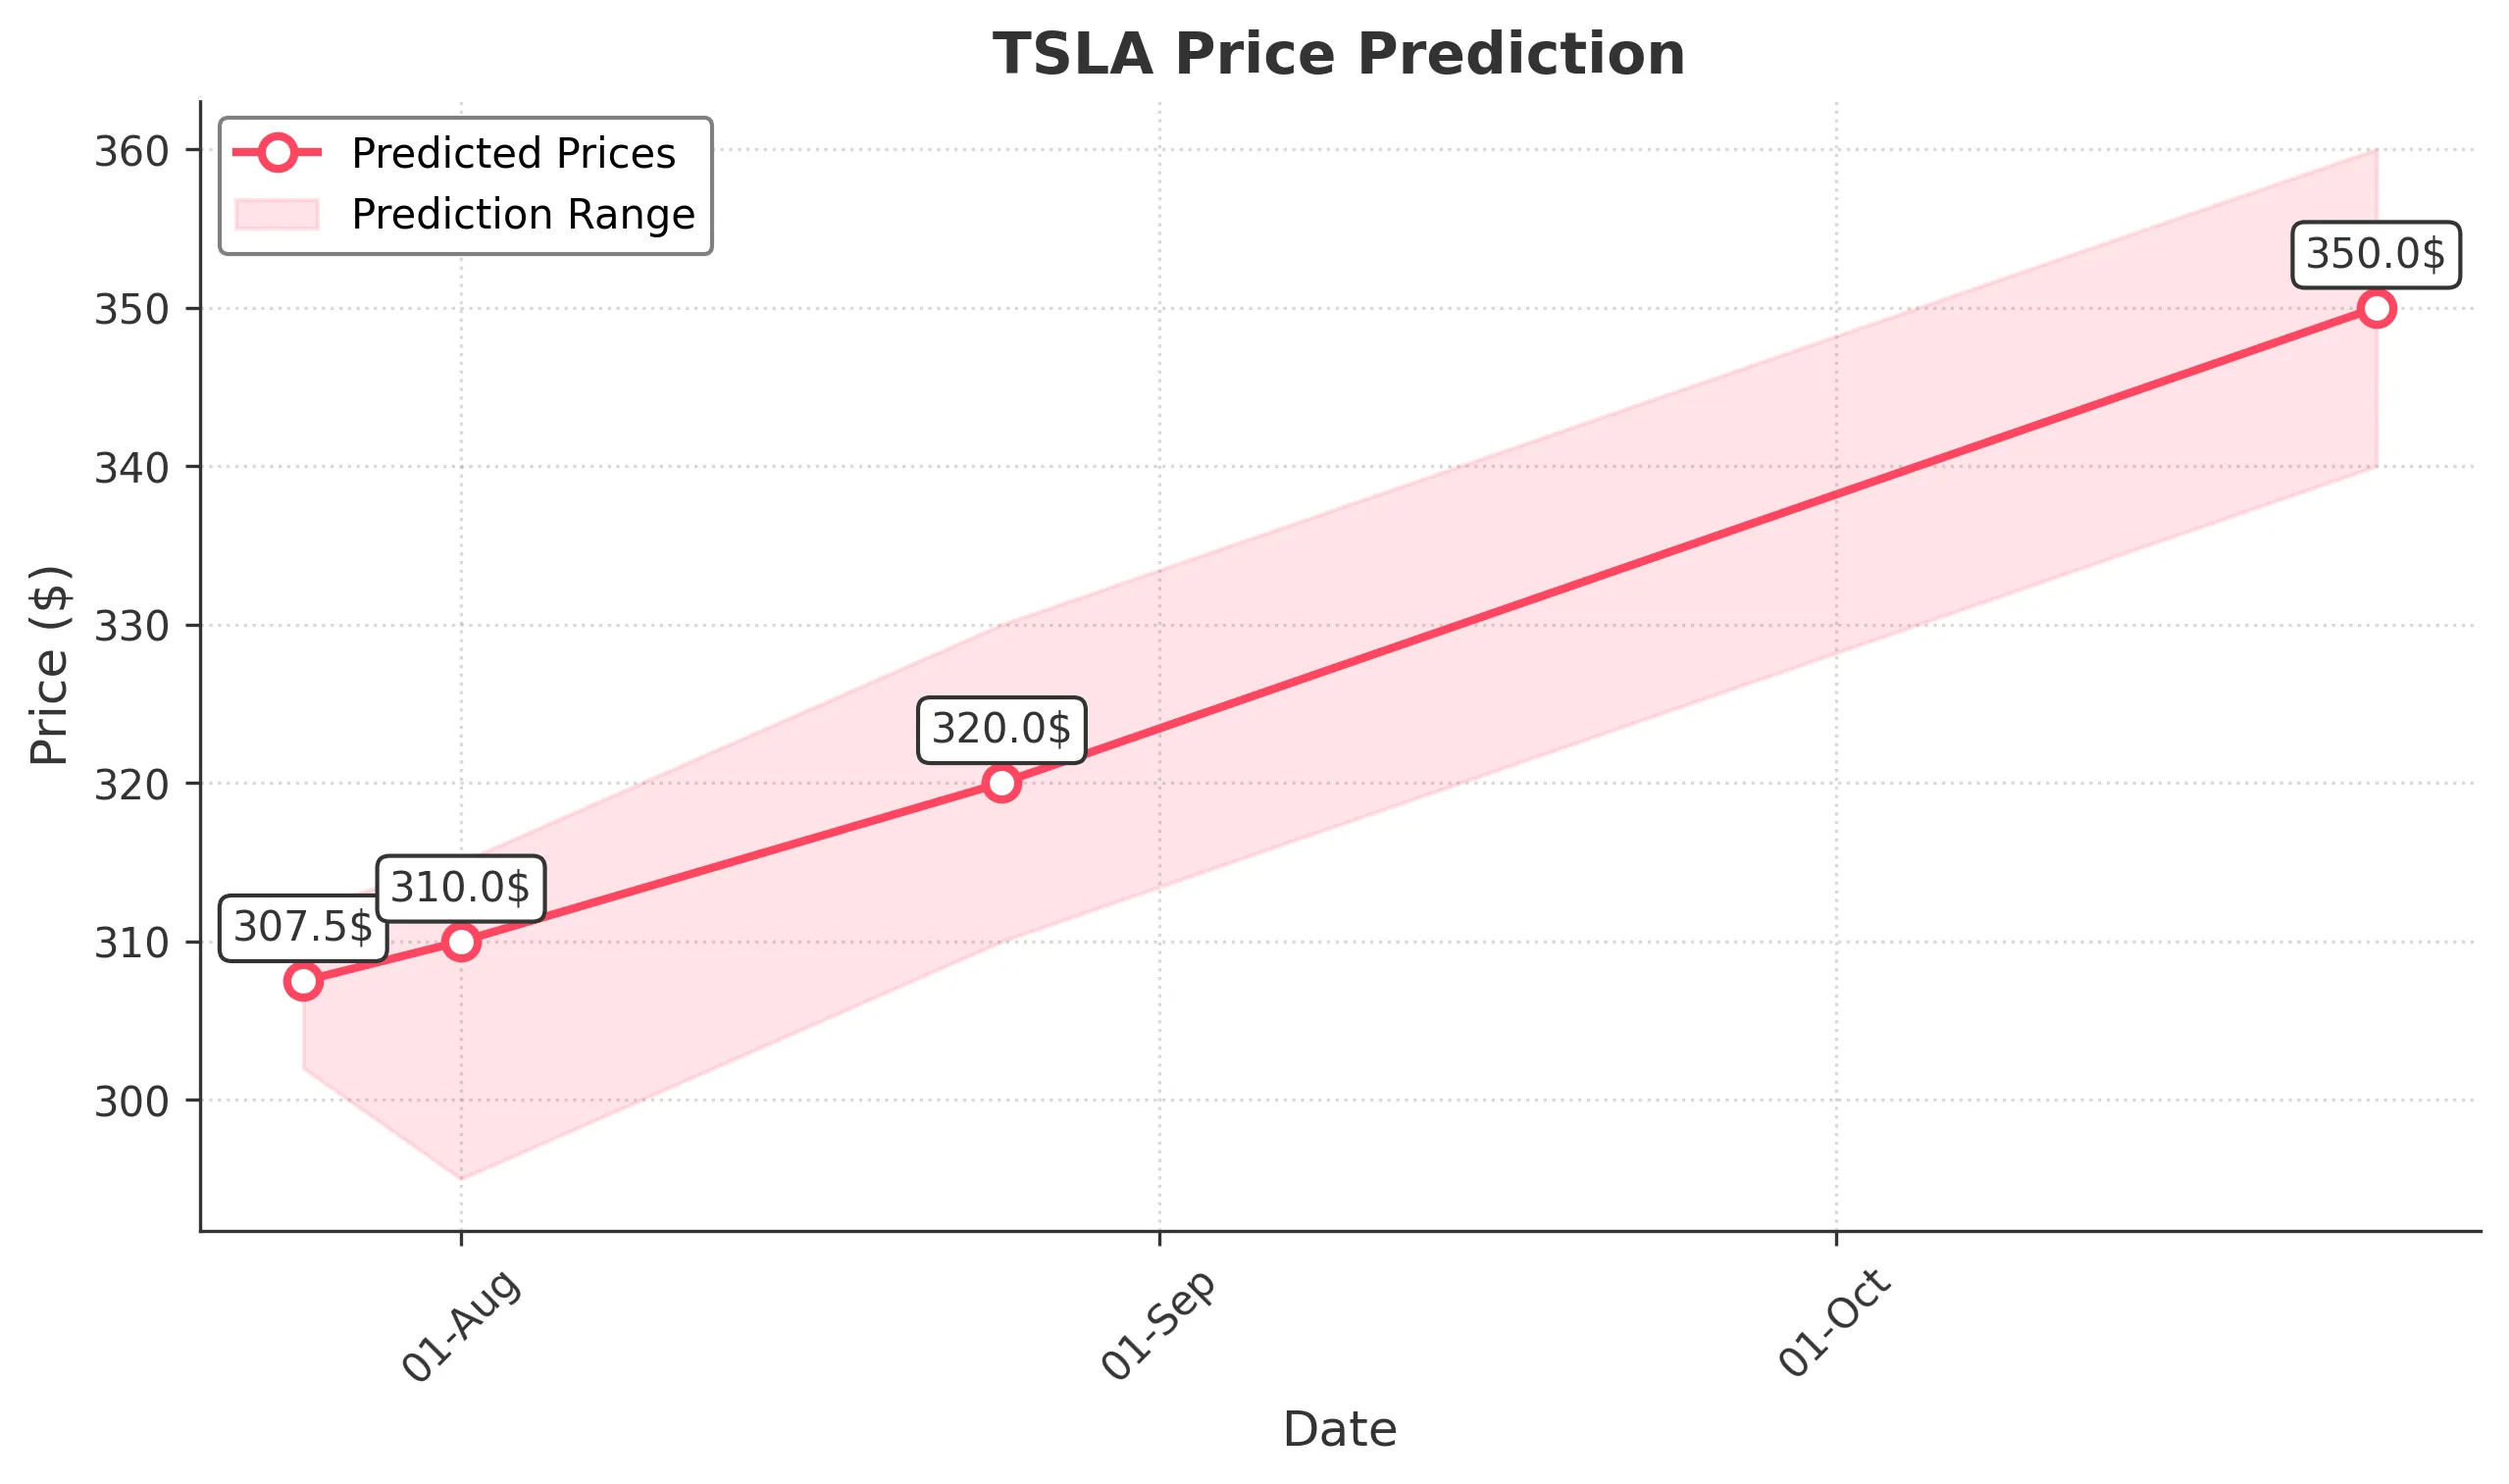
Target: July 25, 2025$307.5
$305
$312
$302
Description
The stock shows a slight bullish trend with a recent Doji pattern indicating indecision. RSI is neutral, and MACD is close to crossing bullish. However, recent volatility suggests caution.
Analysis
Over the past 3 months, TSLA has shown volatility with a recent bearish trend. Key support at 300 and resistance at 350. RSI indicates potential overbought conditions, while volume spikes suggest strong interest. Overall, the market sentiment remains mixed.
Confidence Level
Potential Risks
Market sentiment could shift quickly due to external news or earnings reports, impacting the prediction.
1 Week Prediction
Target: August 1, 2025$310
$308
$315
$295
Description
Expect a slight recovery as the stock approaches key support levels. The MACD shows potential bullish divergence, while the RSI is recovering from oversold conditions. Watch for volume spikes.
Analysis
The stock has been in a bearish phase, with significant fluctuations. Support at 300 is critical, while resistance remains at 350. Recent candlestick patterns suggest indecision, and external factors could influence the next moves.
Confidence Level
Potential Risks
Potential for further downside if market sentiment shifts negatively or if macroeconomic factors come into play.
1 Month Prediction
Target: August 25, 2025$320
$315
$330
$310
Description
A gradual recovery is anticipated as the stock stabilizes. The RSI is expected to trend upwards, and MACD may confirm a bullish crossover. Watch for external market influences.
Analysis
TSLA has shown resilience with key support at 300. The stock's performance has been volatile, but recent patterns indicate a potential bullish reversal. Volume analysis shows increased interest, suggesting a possible upward trend.
Confidence Level
Potential Risks
Unforeseen market events or earnings reports could impact the stock's trajectory.
3 Months Prediction
Target: October 25, 2025$350
$345
$360
$340
Description
Long-term outlook remains bullish as the stock approaches key resistance levels. Positive market sentiment and potential product announcements could drive prices higher.
Analysis
The stock has been in a volatile phase, with significant fluctuations. Key resistance at 350 and support at 300. Technical indicators suggest potential bullish momentum, but external factors could influence the market sentiment.
Confidence Level
Potential Risks
Market volatility and economic conditions could lead to unexpected downturns.