TSLA Trading Predictions
1 Day Prediction
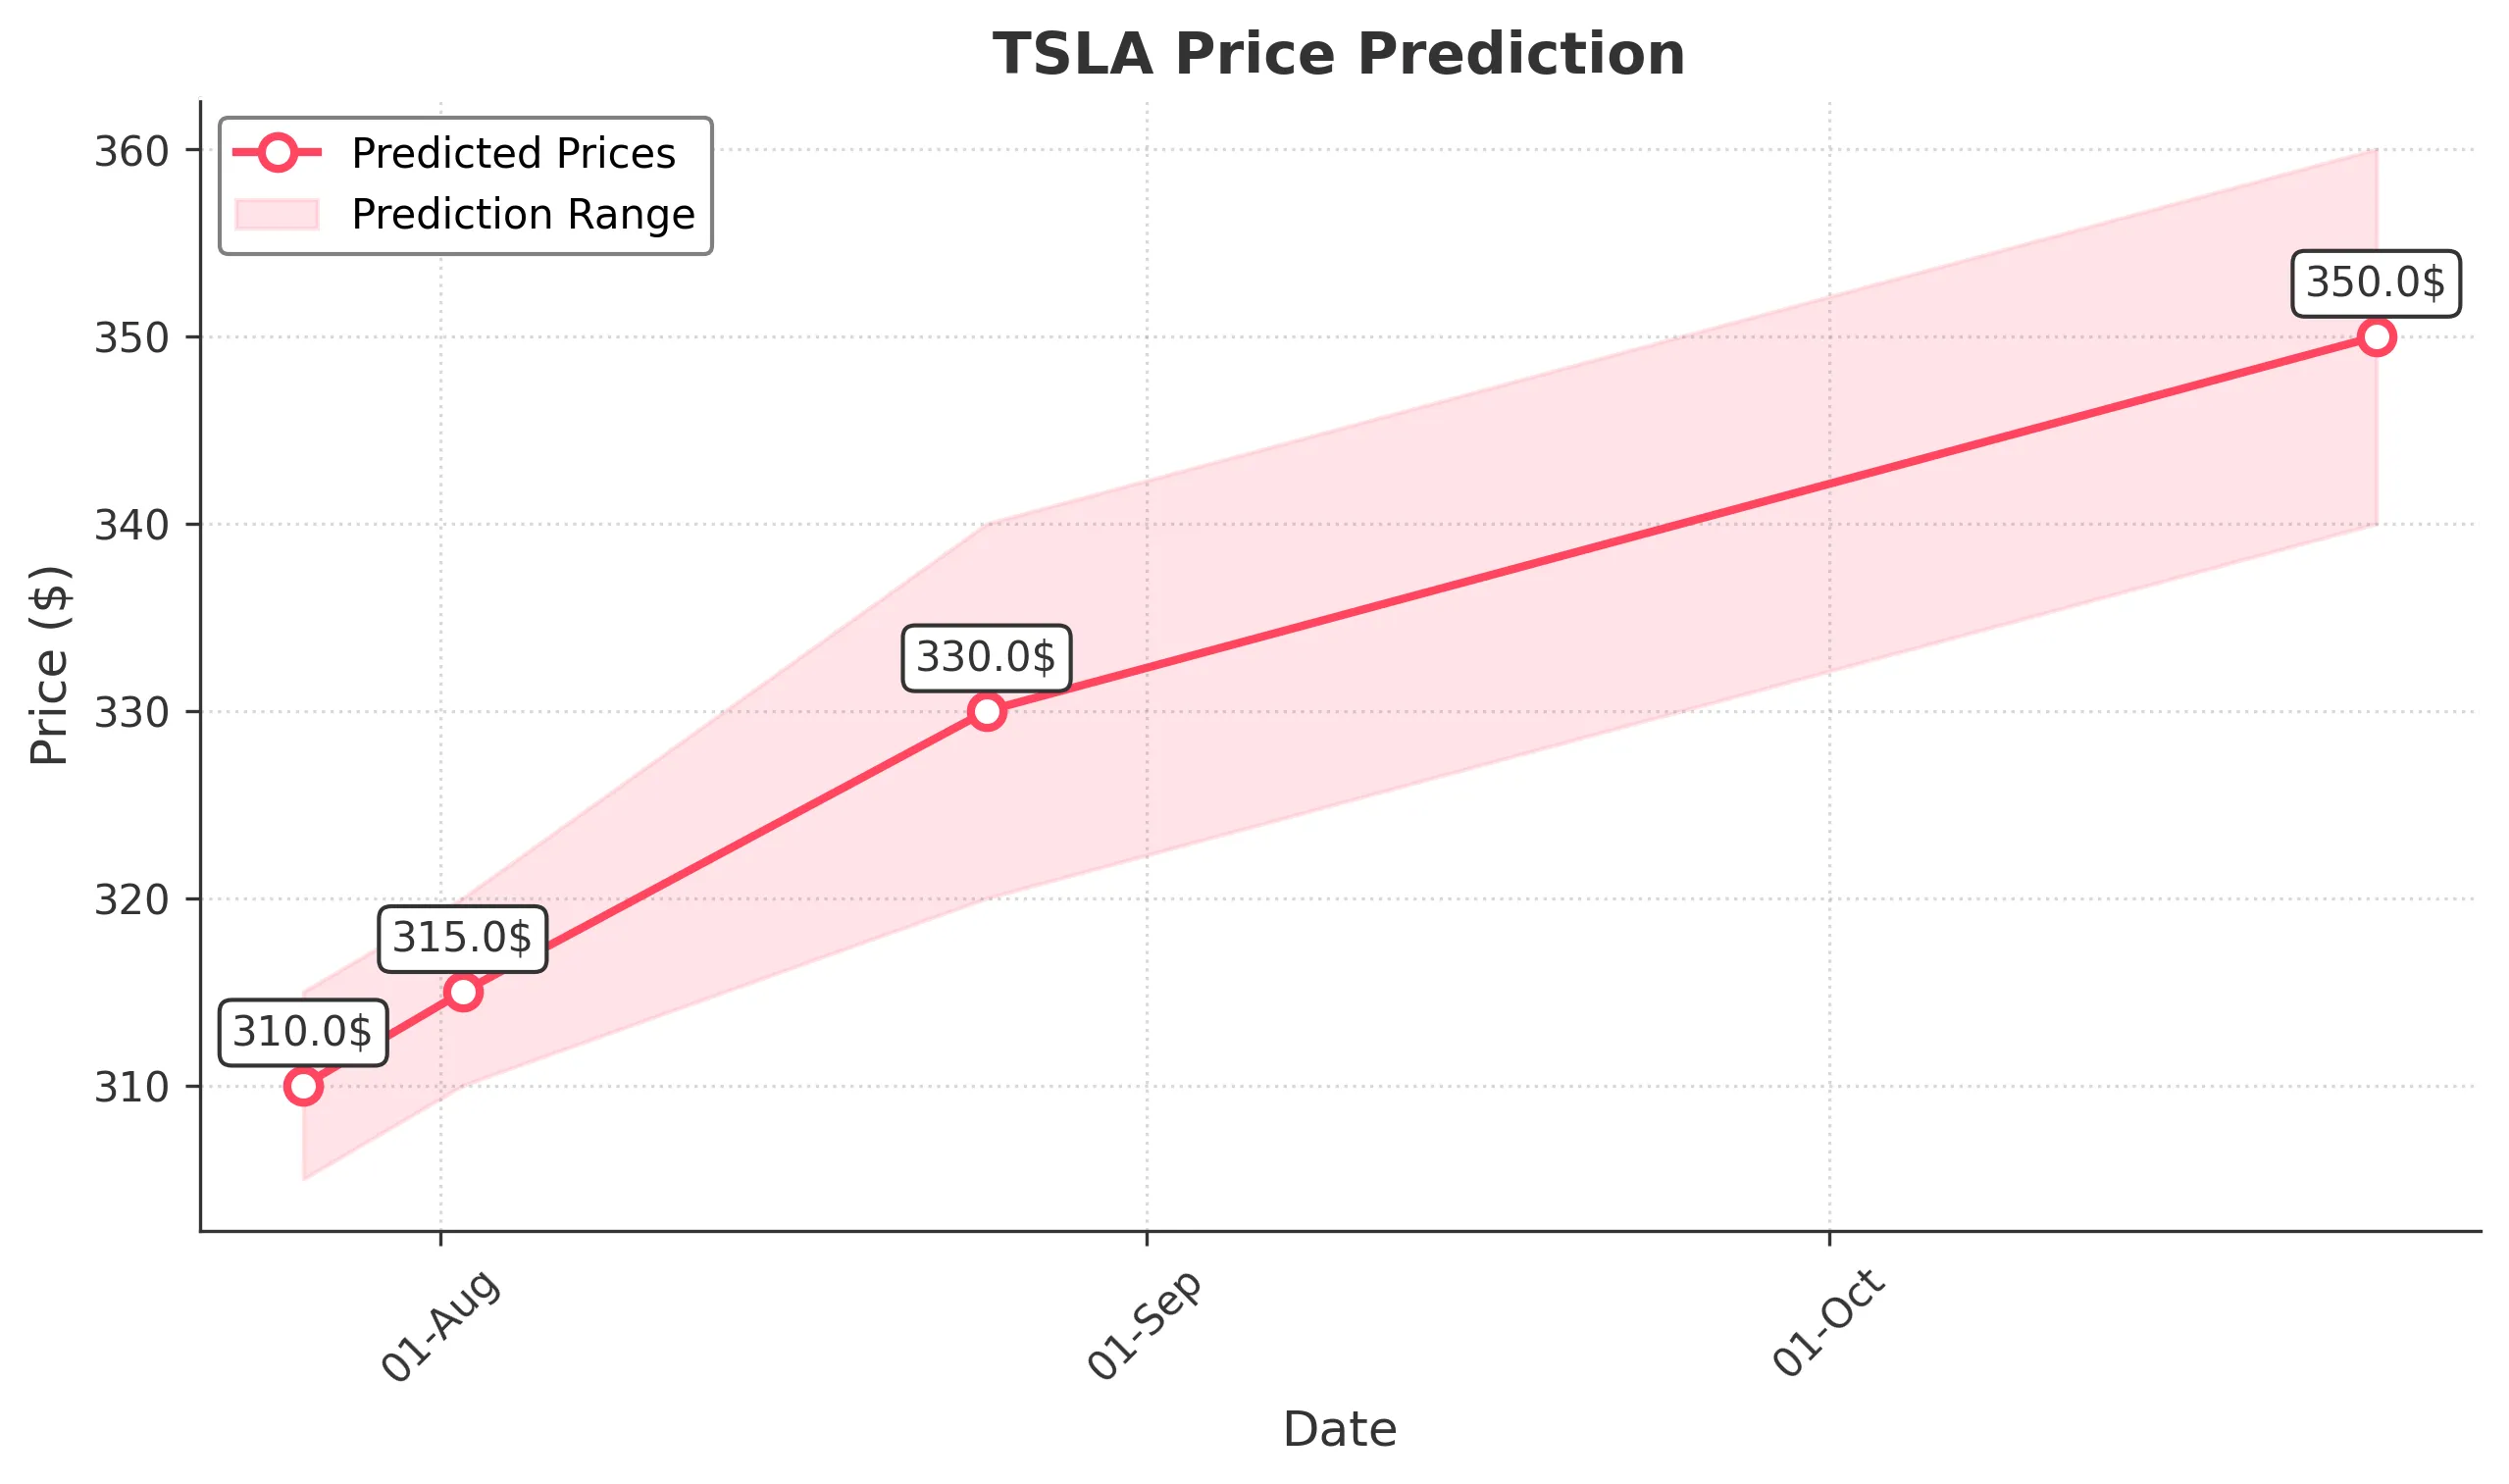
Target: July 26, 2025$310
$310
$315
$305
Description
The stock shows a slight bullish trend with a recent Doji pattern indicating indecision. RSI is neutral, and MACD is close to crossing above the signal line. Expecting a minor rebound after recent declines.
Analysis
Over the past 3 months, TSLA has shown significant volatility, with a recent bearish trend after reaching highs above $350. Key support is around $300, while resistance is near $350. Volume spikes indicate strong interest, but recent declines raise concerns.
Confidence Level
Potential Risks
Market volatility and external news could impact the prediction. A bearish reversal is possible if selling pressure increases.
1 Week Prediction
Target: August 2, 2025$315
$312
$320
$310
Description
Expecting a recovery as the stock approaches key support levels. The MACD shows potential bullish momentum, and the RSI is recovering from oversold conditions. A positive market sentiment could drive prices higher.
Analysis
TSLA has been in a bearish phase recently, but signs of recovery are emerging. The stock is testing support levels around $310, with potential for a bounce. Technical indicators suggest a possible upward move, but caution is warranted due to market conditions.
Confidence Level
Potential Risks
Unforeseen macroeconomic events or earnings reports could lead to volatility. Watch for any bearish candlestick patterns.
1 Month Prediction
Target: August 25, 2025$330
$325
$340
$320
Description
With a potential bullish reversal forming, the stock may rise as it breaks above recent resistance levels. The MACD is showing bullish divergence, and the RSI is trending upwards, indicating positive momentum.
Analysis
The past three months have seen TSLA fluctuate significantly, with a recent bearish trend. However, the stock is approaching key support levels, and technical indicators suggest a potential recovery. The market's reaction to earnings and macroeconomic factors will be crucial.
Confidence Level
Potential Risks
Market sentiment can shift quickly, and any negative news could reverse the trend. Watch for volume spikes that may indicate selling pressure.
3 Months Prediction
Target: October 25, 2025$350
$345
$360
$340
Description
If the bullish trend continues, TSLA could reach $350 as it breaks through resistance levels. Positive earnings and market sentiment could support this upward movement, but caution is advised.
Analysis
TSLA's performance over the last three months has been marked by volatility and significant price swings. The stock is currently in a corrective phase, but potential bullish signals are emerging. Key resistance at $350 and support at $300 will be critical in determining future price action.
Confidence Level
Potential Risks
Long-term predictions are subject to greater uncertainty. Economic conditions, competition, and regulatory changes could impact performance significantly.