TSLA Trading Predictions
1 Day Prediction
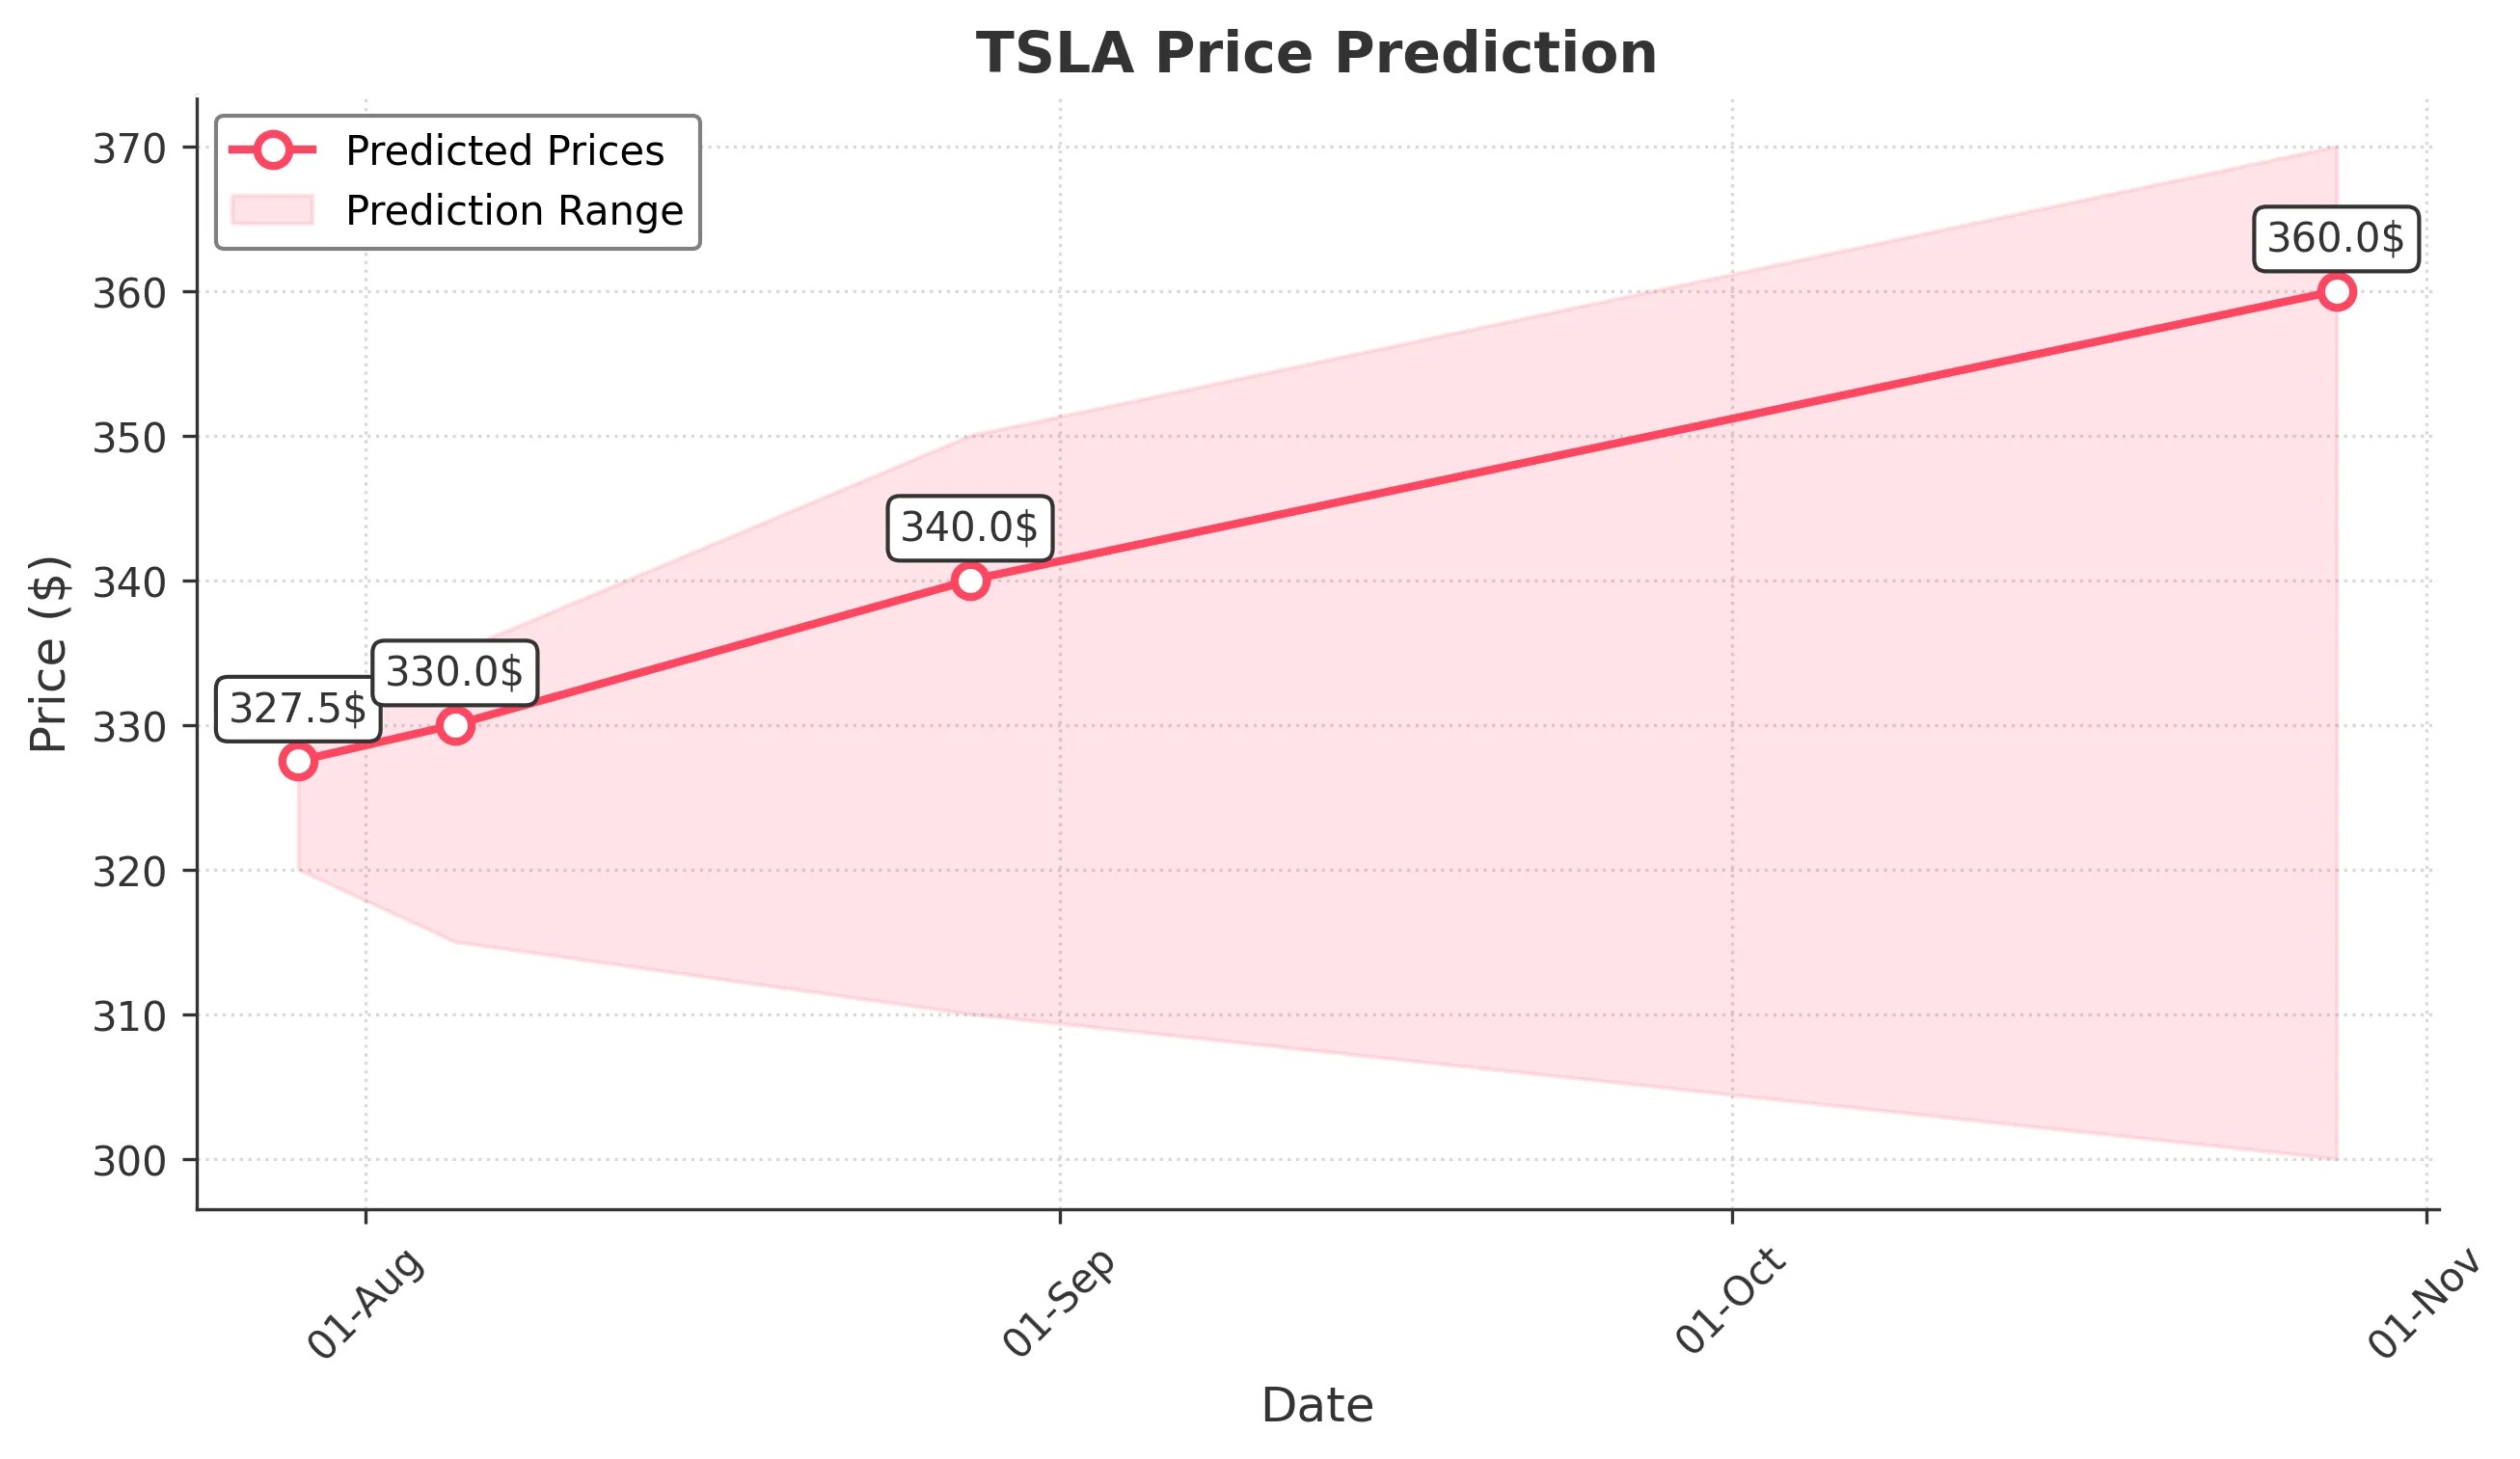
Target: July 29, 2025$327.5
$325
$330
$320
Description
The stock shows a bullish trend with a recent upward movement. The RSI is approaching overbought levels, indicating potential for a pullback. However, strong support at $320 and positive market sentiment may drive the price higher.
Analysis
Over the past 3 months, TSLA has shown a bullish trend with significant price increases. Key support is at $320, while resistance is around $350. The MACD indicates upward momentum, but the RSI suggests caution as it nears overbought territory.
Confidence Level
Potential Risks
Potential volatility due to earnings reports or macroeconomic news could impact the prediction.
1 Week Prediction
Target: August 5, 2025$330
$327.5
$335
$315
Description
The stock is expected to maintain its upward trajectory, supported by recent bullish candlestick patterns. However, the RSI indicates potential overbought conditions, suggesting a possible pullback in the near term.
Analysis
TSLA has experienced significant volatility, with recent highs around $350. The MACD is bullish, but the RSI indicates caution. Volume spikes suggest strong interest, but the potential for a correction exists if the stock becomes overextended.
Confidence Level
Potential Risks
Market sentiment can shift quickly, and any negative news could lead to a reversal.
1 Month Prediction
Target: August 28, 2025$340
$330
$350
$310
Description
Expect continued bullish momentum, with potential resistance at $350. The stock's recent performance and positive market sentiment support this outlook, but overbought conditions may lead to short-term corrections.
Analysis
The stock has shown a strong upward trend, with key support at $320. The MACD remains bullish, but the RSI indicates potential overbought conditions. Volume analysis shows increased interest, but caution is warranted due to possible corrections.
Confidence Level
Potential Risks
Economic factors or earnings reports could significantly impact stock performance.
3 Months Prediction
Target: October 28, 2025$360
$340
$370
$300
Description
Long-term bullish outlook supported by strong fundamentals and market sentiment. However, potential economic downturns or negative news could lead to volatility and corrections.
Analysis
TSLA has shown a strong bullish trend, with significant price movements. Key support is at $300, while resistance is at $370. The MACD indicates bullish momentum, but the RSI suggests caution. Market sentiment remains positive, but external factors could introduce volatility.
Confidence Level
Potential Risks
Unforeseen macroeconomic events or changes in market sentiment could impact the prediction.