TSLA Trading Predictions
1 Day Prediction
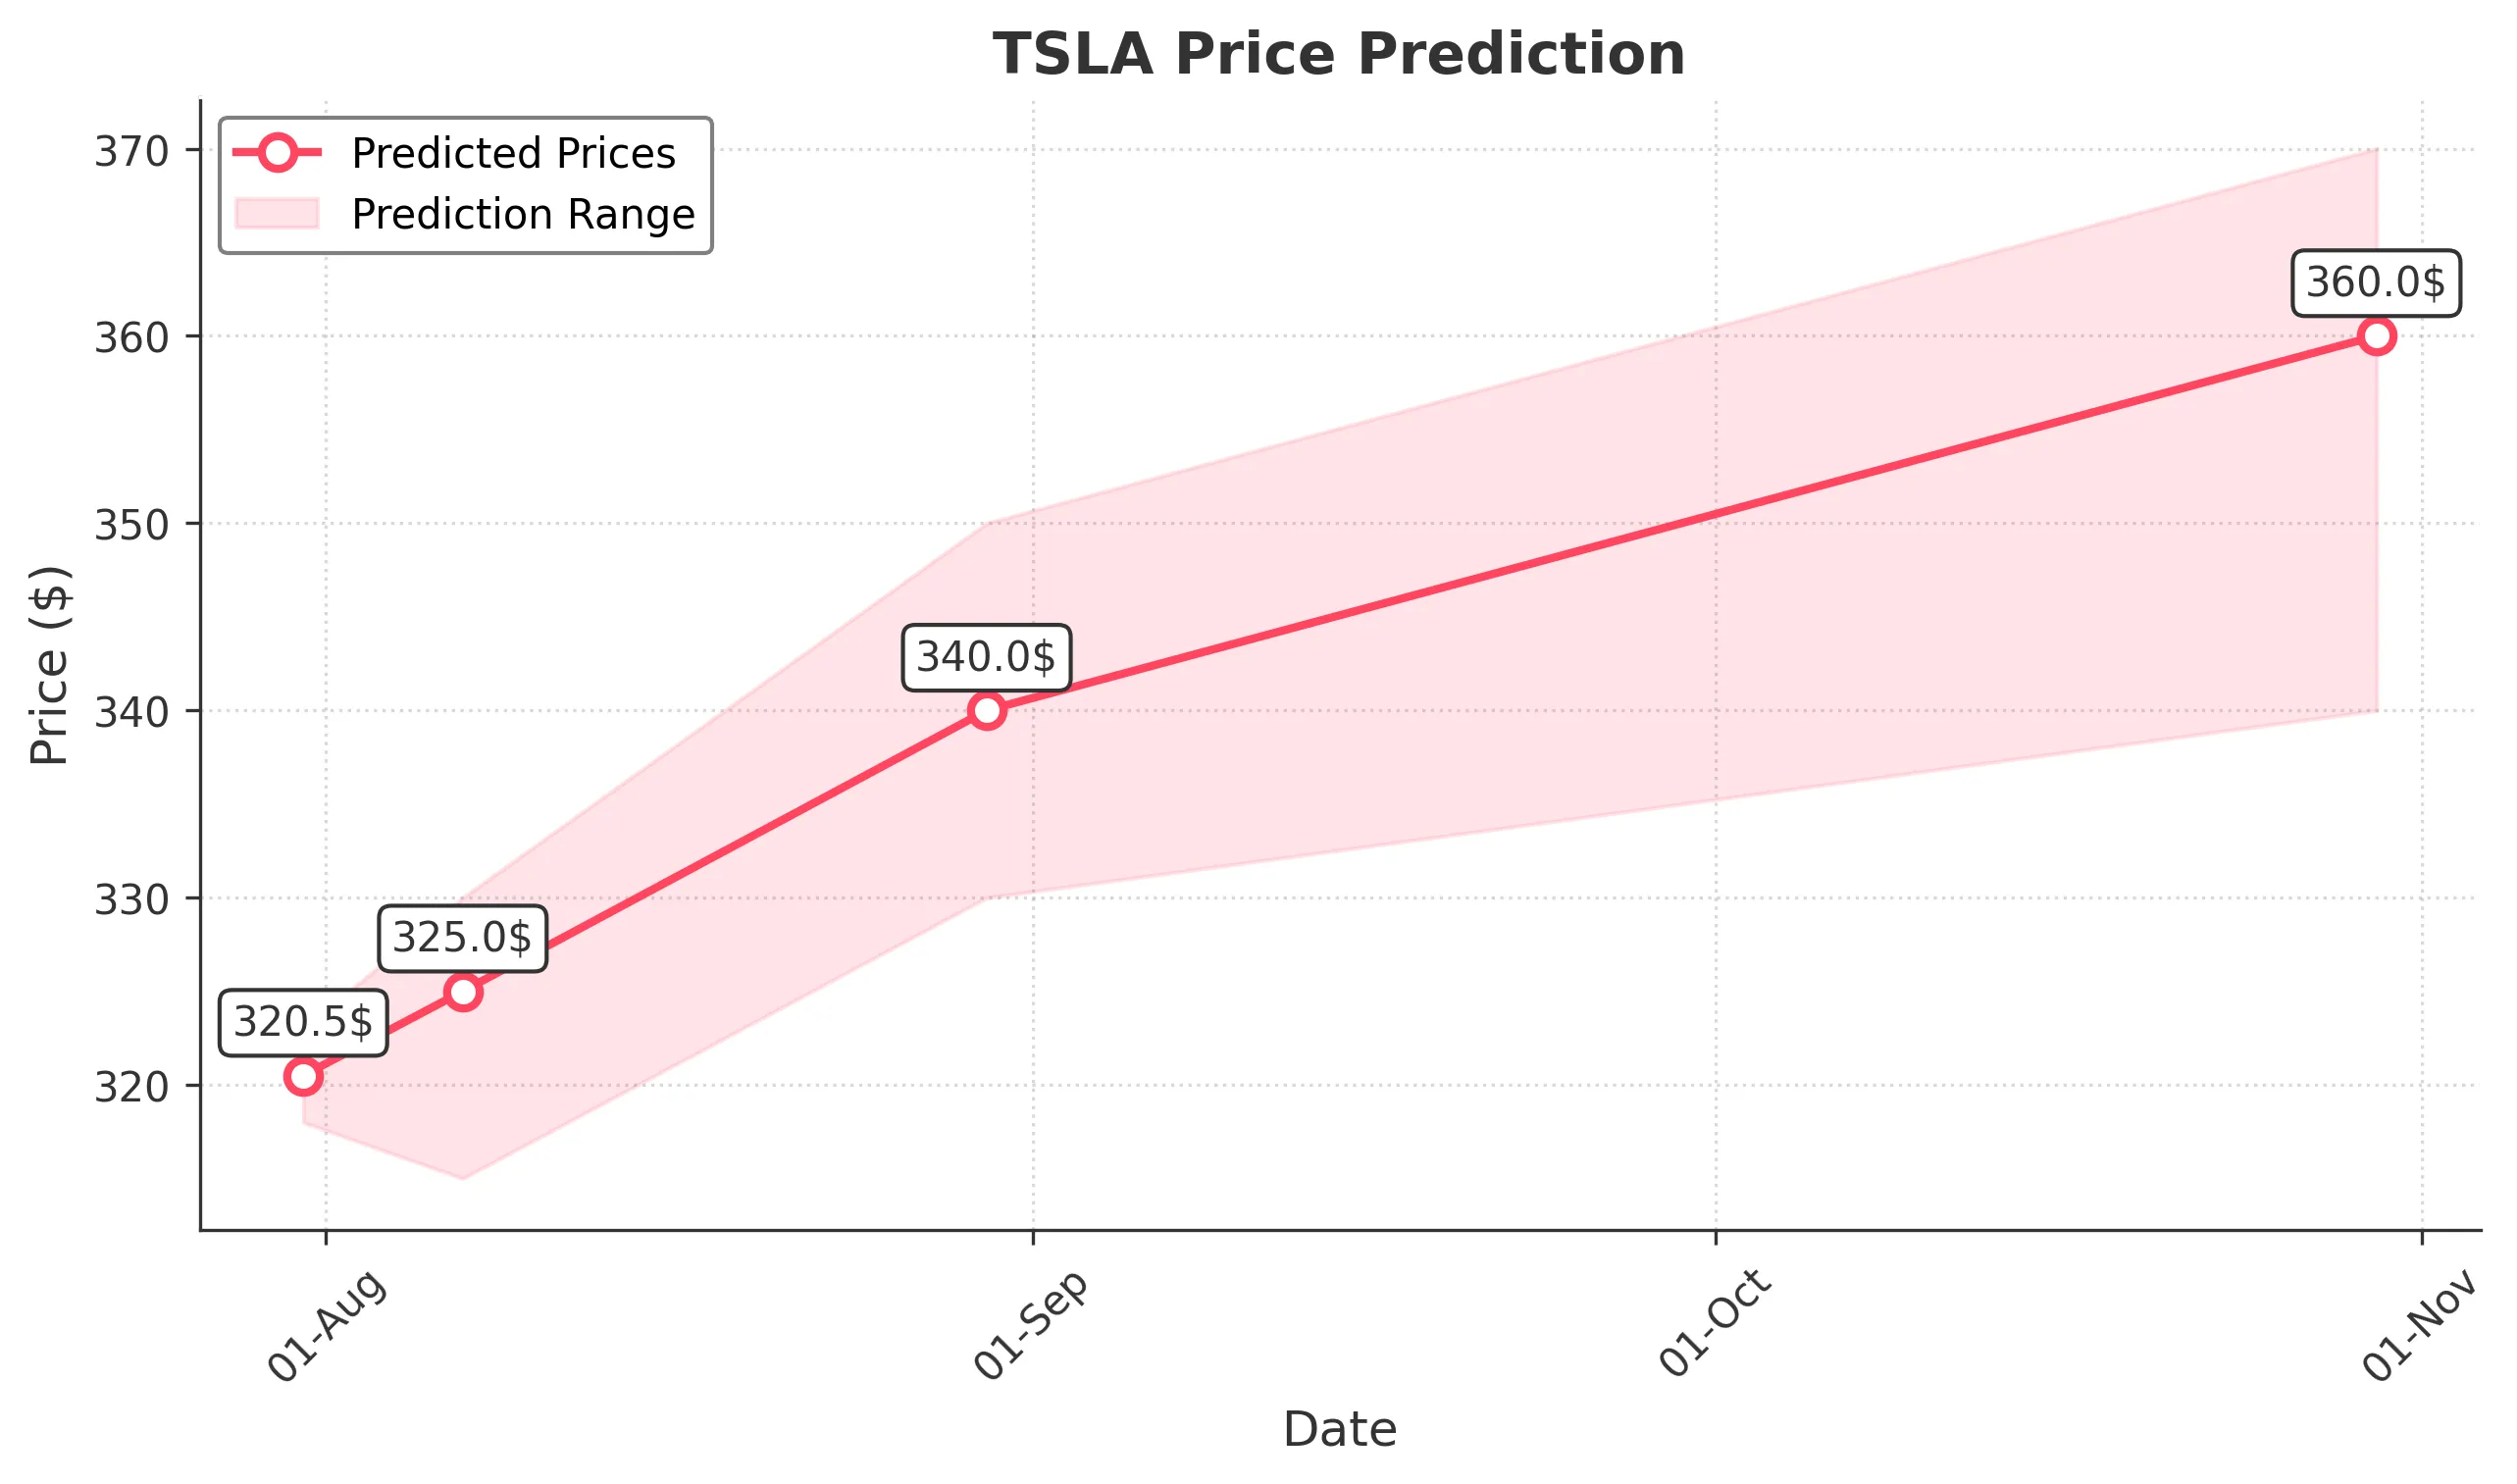
Target: July 31, 2025$320.5
$321
$323
$318
Description
The stock shows a slight bullish trend with a potential close around 320.50. The RSI is neutral, and MACD indicates a potential upward momentum. However, recent volatility suggests caution.
Analysis
Over the past 3 months, TSLA has shown significant volatility, with a recent bearish trend. Key support at 300 and resistance at 350. Moving averages indicate mixed signals, while volume spikes suggest investor interest. Overall, the trend is uncertain.
Confidence Level
Potential Risks
Market sentiment could shift due to external news or earnings reports, impacting the prediction.
1 Week Prediction
Target: August 7, 2025$325
$320
$330
$315
Description
Expecting a close around 325.00 as the stock may recover slightly. The Bollinger Bands suggest potential upward movement, but the recent bearish trend raises concerns.
Analysis
The stock has been fluctuating, with a recent drop below 330. Key support at 315 and resistance at 350. Technical indicators show mixed signals, with volume patterns indicating cautious trading. Overall, the outlook remains uncertain.
Confidence Level
Potential Risks
Potential for further declines if market sentiment worsens or if macroeconomic factors negatively impact TSLA.
1 Month Prediction
Target: August 30, 2025$340
$335
$350
$330
Description
A potential recovery to 340.00 is expected as the stock may stabilize. The MACD shows signs of bullish divergence, but caution is warranted due to recent volatility.
Analysis
TSLA has experienced significant fluctuations, with a bearish trend recently. Key support at 315 and resistance at 350. Technical indicators are mixed, with volume spikes indicating investor interest. The outlook remains cautious.
Confidence Level
Potential Risks
Uncertainty in market conditions and potential earnings reports could lead to unexpected price movements.
3 Months Prediction
Target: October 30, 2025$360
$355
$370
$340
Description
A potential rise to 360.00 is anticipated as the stock may recover from recent lows. The RSI indicates oversold conditions, suggesting a possible rebound.
Analysis
Over the past 3 months, TSLA has shown significant volatility with a bearish trend. Key support at 300 and resistance at 350. Technical indicators are mixed, with volume patterns indicating cautious trading. The outlook remains uncertain.
Confidence Level
Potential Risks
Long-term predictions are highly uncertain due to market volatility and external economic factors that could impact TSLA's performance.