TSLA Trading Predictions
1 Day Prediction
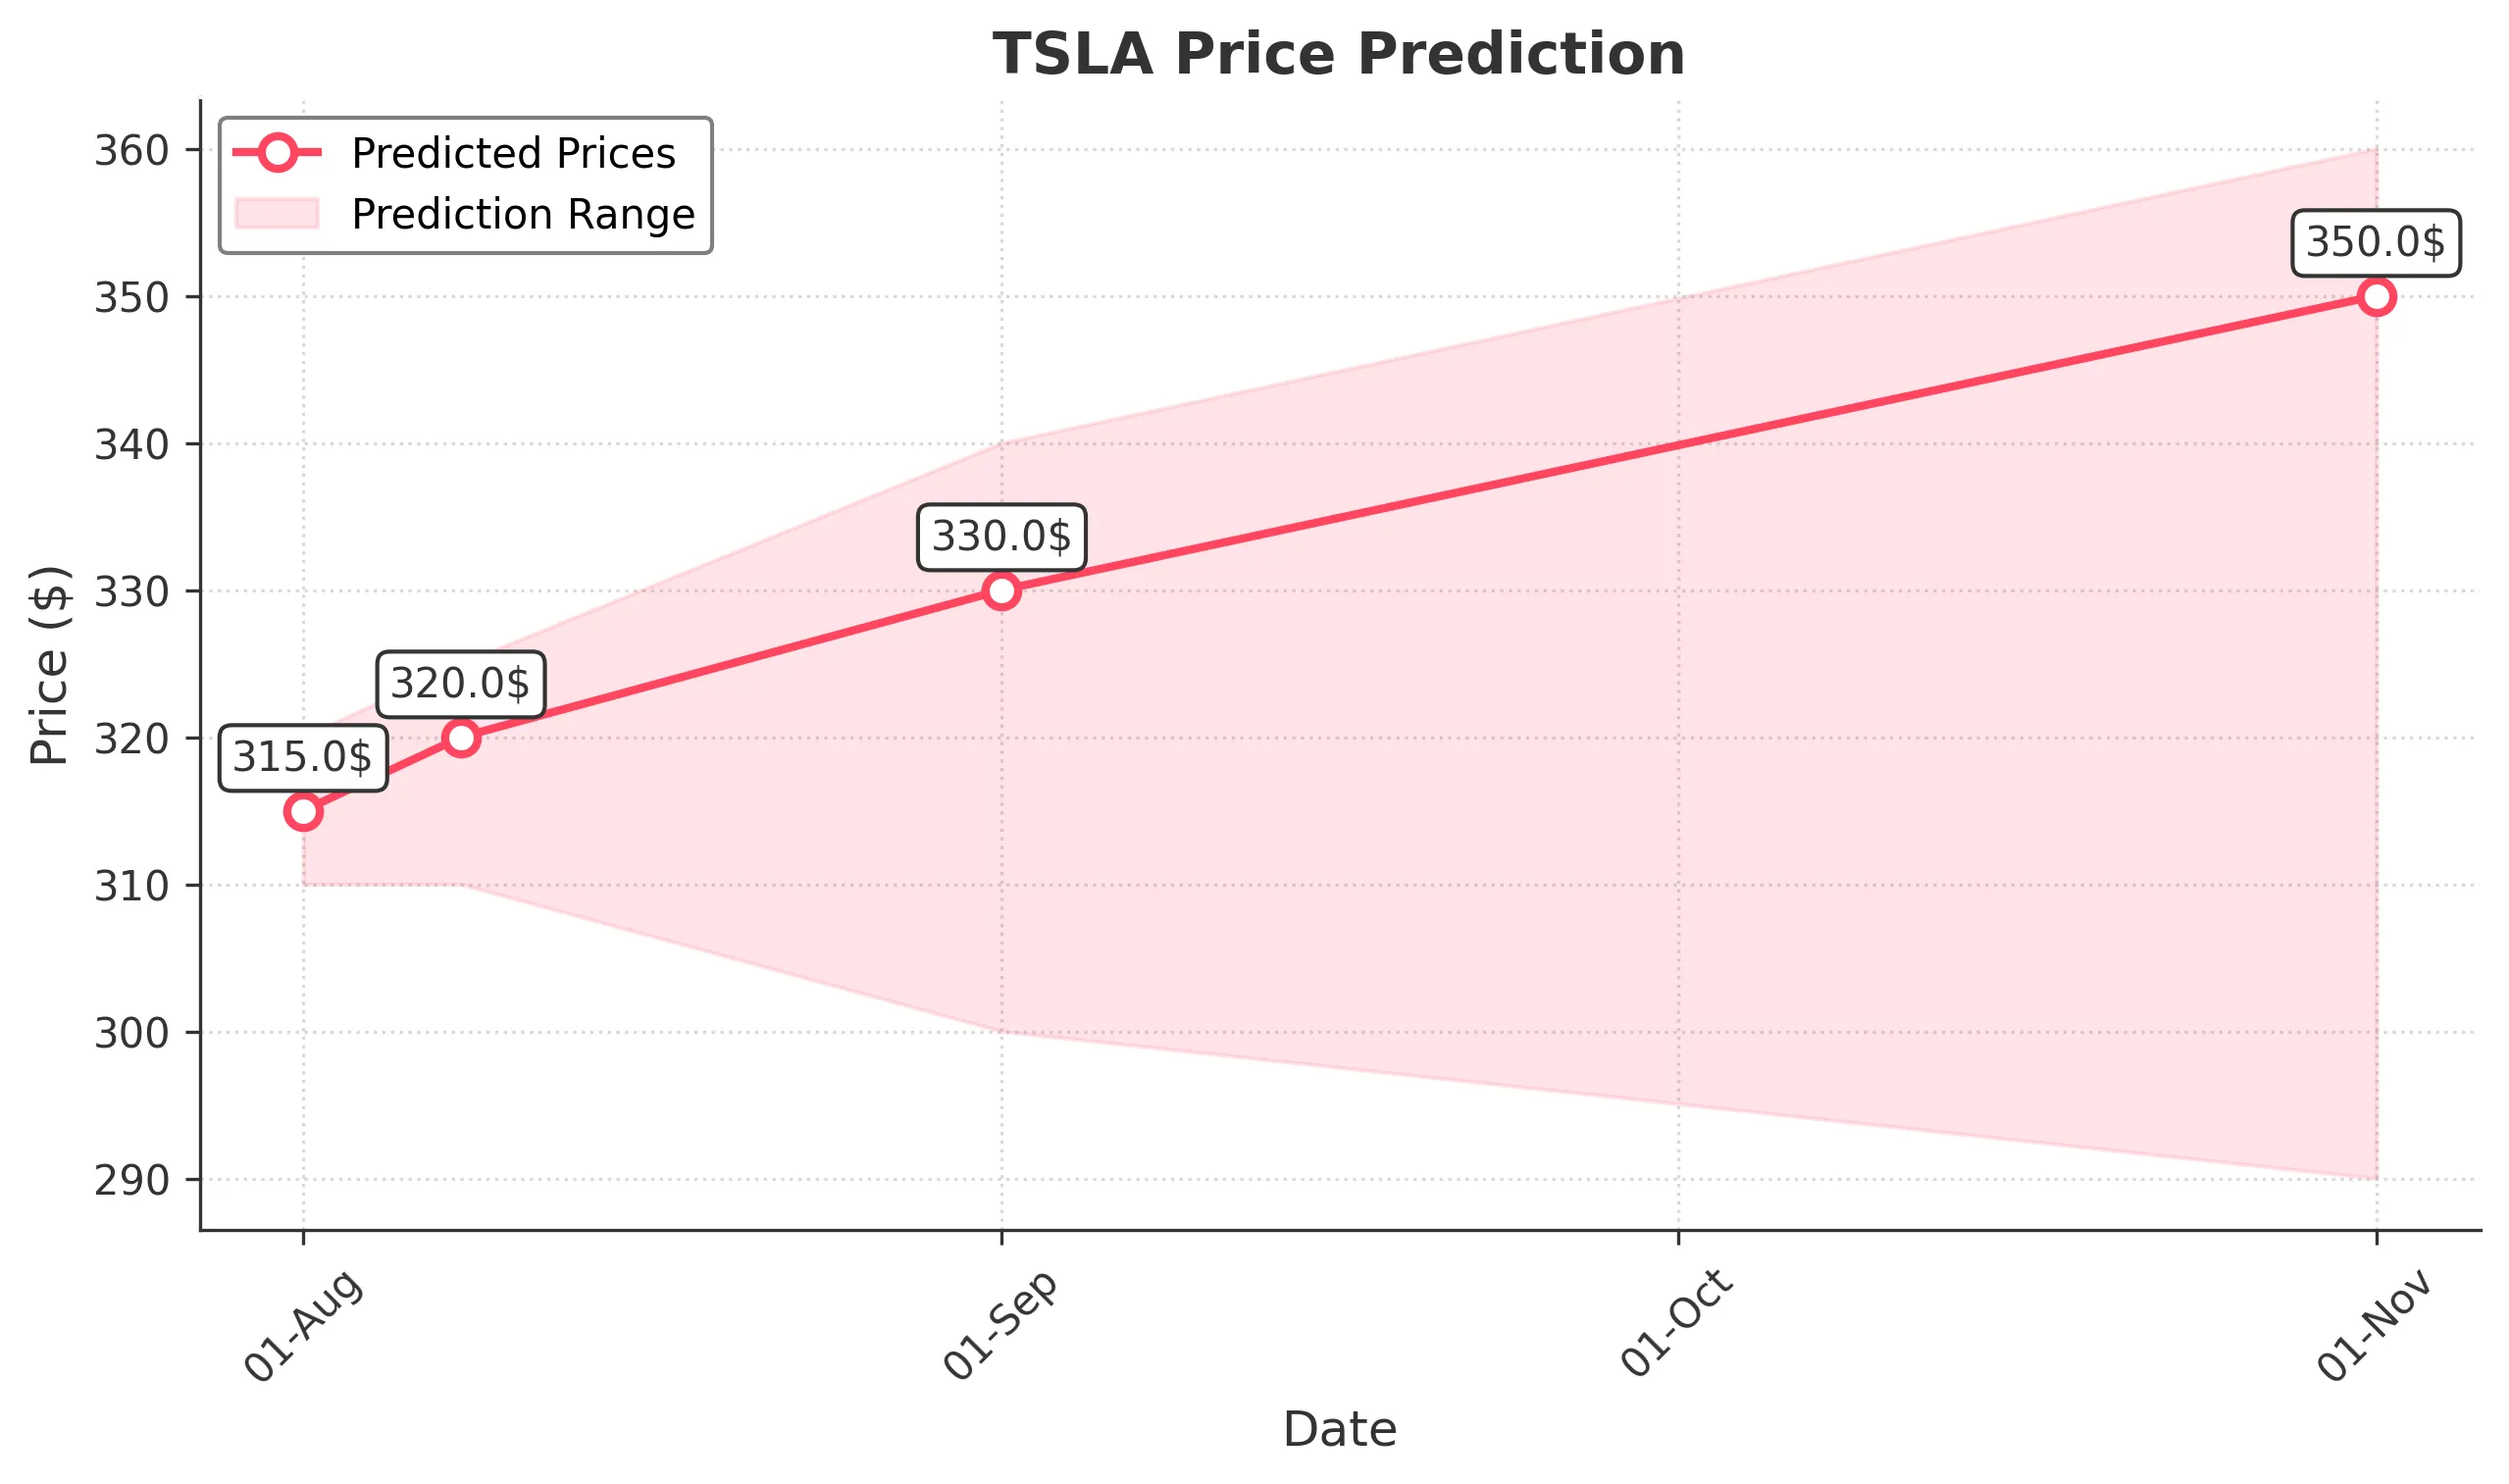
Target: August 1, 2025$315
$314
$320
$310
Description
The stock shows a slight bullish trend with a recent Doji candlestick indicating indecision. The RSI is around 55, suggesting room for upward movement. However, MACD is flattening, indicating potential resistance ahead.
Analysis
Over the past 3 months, TSLA has shown a mix of bullish and bearish trends, with significant support at $310 and resistance around $350. Recent volume spikes indicate strong interest, but the stock has faced volatility, especially after reaching highs in mid-May.
Confidence Level
Potential Risks
Market volatility and external news could impact the price. A bearish reversal is possible if the price fails to break above recent highs.
1 Week Prediction
Target: August 8, 2025$320
$315
$325
$310
Description
The stock is expected to continue its upward momentum, supported by a bullish MACD crossover. However, the RSI nearing 70 indicates overbought conditions, which could lead to a pullback.
Analysis
TSLA has been fluctuating between $310 and $350, with recent bullish momentum. The stock's performance has been influenced by macroeconomic factors, including interest rates and market sentiment, which remain mixed.
Confidence Level
Potential Risks
Potential market corrections and earnings reports could introduce volatility. A failure to maintain above $315 could trigger selling pressure.
1 Month Prediction
Target: September 1, 2025$330
$325
$340
$300
Description
A bullish outlook is anticipated as the stock approaches key Fibonacci retracement levels. However, the recent bearish engulfing pattern suggests caution, as it may indicate a temporary reversal.
Analysis
The past three months have shown TSLA's volatility, with significant price swings. Key support at $300 and resistance at $350 are critical levels to watch. The stock's performance is closely tied to broader market trends and investor sentiment.
Confidence Level
Potential Risks
Economic data releases and geopolitical events could significantly impact market sentiment. A break below $300 would signal a bearish trend.
3 Months Prediction
Target: November 1, 2025$350
$340
$360
$290
Description
Long-term bullish sentiment is supported by strong fundamentals and potential product launches. However, the stock's high volatility and recent bearish patterns could lead to significant fluctuations.
Analysis
TSLA's performance over the last three months has been characterized by high volatility and mixed trends. The stock has shown resilience but faces challenges from market sentiment and external economic factors. Key support at $290 and resistance at $360 will be crucial.
Confidence Level
Potential Risks
Unforeseen market events, regulatory changes, or economic downturns could adversely affect the stock. A significant drop below $290 would indicate a bearish trend.