TSLA Trading Predictions
1 Day Prediction
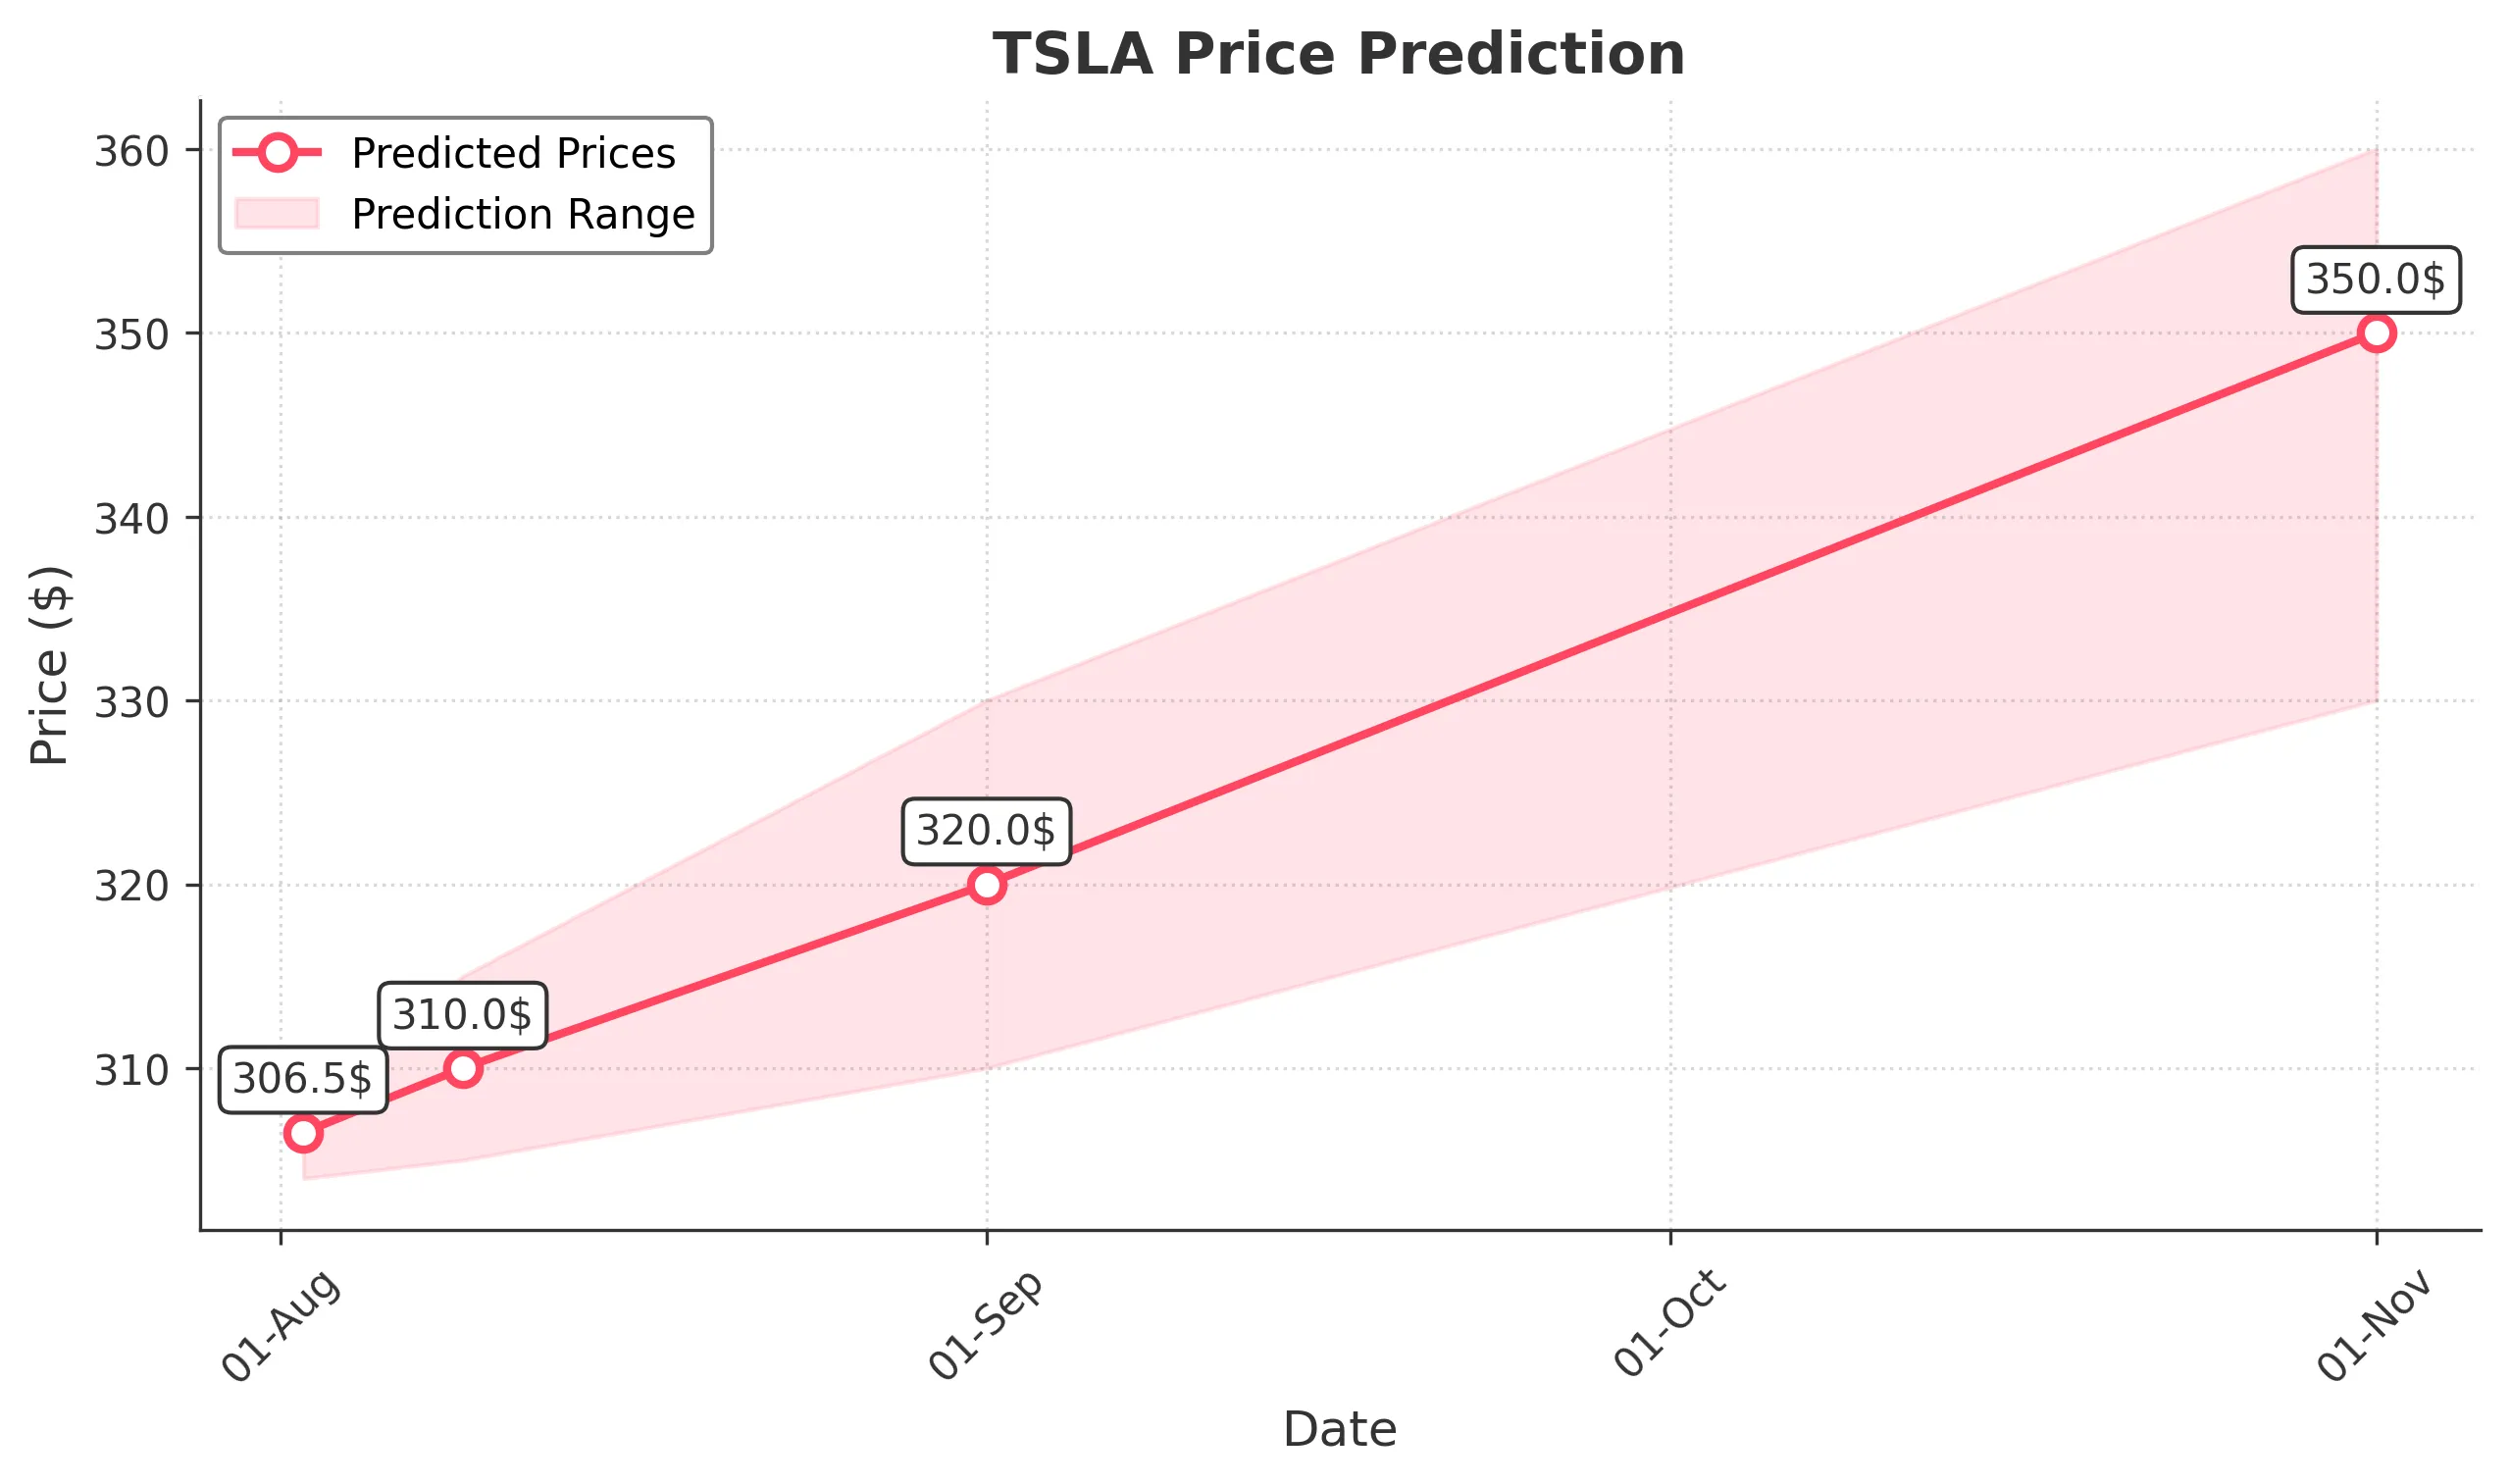
Target: August 2, 2025$306.5
$305.5
$308
$304
Description
The stock shows a slight bullish trend with a potential close around 306.50. The recent candlestick patterns indicate indecision, but the RSI is neutral, suggesting a possible consolidation. Volume remains moderate, indicating steady interest.
Analysis
Over the past 3 months, TSLA has shown volatility with significant price swings. Key support is around 300, while resistance is near 350. The MACD indicates a bearish divergence, and the ATR suggests increased volatility. Recent volume spikes indicate heightened interest, but the overall trend is uncertain.
Confidence Level
Potential Risks
Market sentiment could shift due to external news or earnings reports, which may impact the price unexpectedly.
1 Week Prediction
Target: August 9, 2025$310
$308
$315
$305
Description
Expect a close around 310.00 as the stock may rebound from recent lows. The Bollinger Bands suggest a potential breakout, while the RSI is approaching oversold territory, indicating a possible reversal. Volume is expected to increase as traders react.
Analysis
The stock has been in a bearish phase recently, with significant support at 300. The moving averages are converging, indicating potential for a reversal. Volume patterns show increased activity, suggesting traders are positioning for a move. Overall, the sentiment is cautiously optimistic.
Confidence Level
Potential Risks
Unforeseen macroeconomic events or earnings surprises could lead to volatility, impacting the accuracy of this prediction.
1 Month Prediction
Target: September 1, 2025$320
$315
$330
$310
Description
A close around 320.00 is anticipated as the stock may recover from recent lows. The Fibonacci retracement levels suggest a target near this price, and the MACD is showing signs of bullish momentum. Volume is expected to remain strong.
Analysis
TSLA has experienced fluctuations, with a recent bearish trend. Key resistance is at 350, while support is at 300. The RSI indicates potential for recovery, and the ATR suggests increased volatility. Overall, the market sentiment is mixed, with potential for upward movement.
Confidence Level
Potential Risks
Market volatility and external factors such as economic data releases could affect the stock's trajectory.
3 Months Prediction
Target: November 1, 2025$350
$340
$360
$330
Description
A close around 350.00 is projected as the stock may stabilize after recent volatility. The long-term trend suggests a bullish outlook, supported by positive market sentiment and potential product announcements. Volume is expected to increase as interest grows.
Analysis
Over the last three months, TSLA has shown significant volatility with a bearish trend recently. Key support is at 300, while resistance is at 350. The MACD indicates potential bullish momentum, and the RSI suggests a recovery phase. Overall, the market sentiment is cautiously optimistic, but risks remain.
Confidence Level
Potential Risks
Long-term predictions are subject to greater uncertainty due to potential market shifts, economic conditions, and company performance.