TSLA Trading Predictions
1 Day Prediction
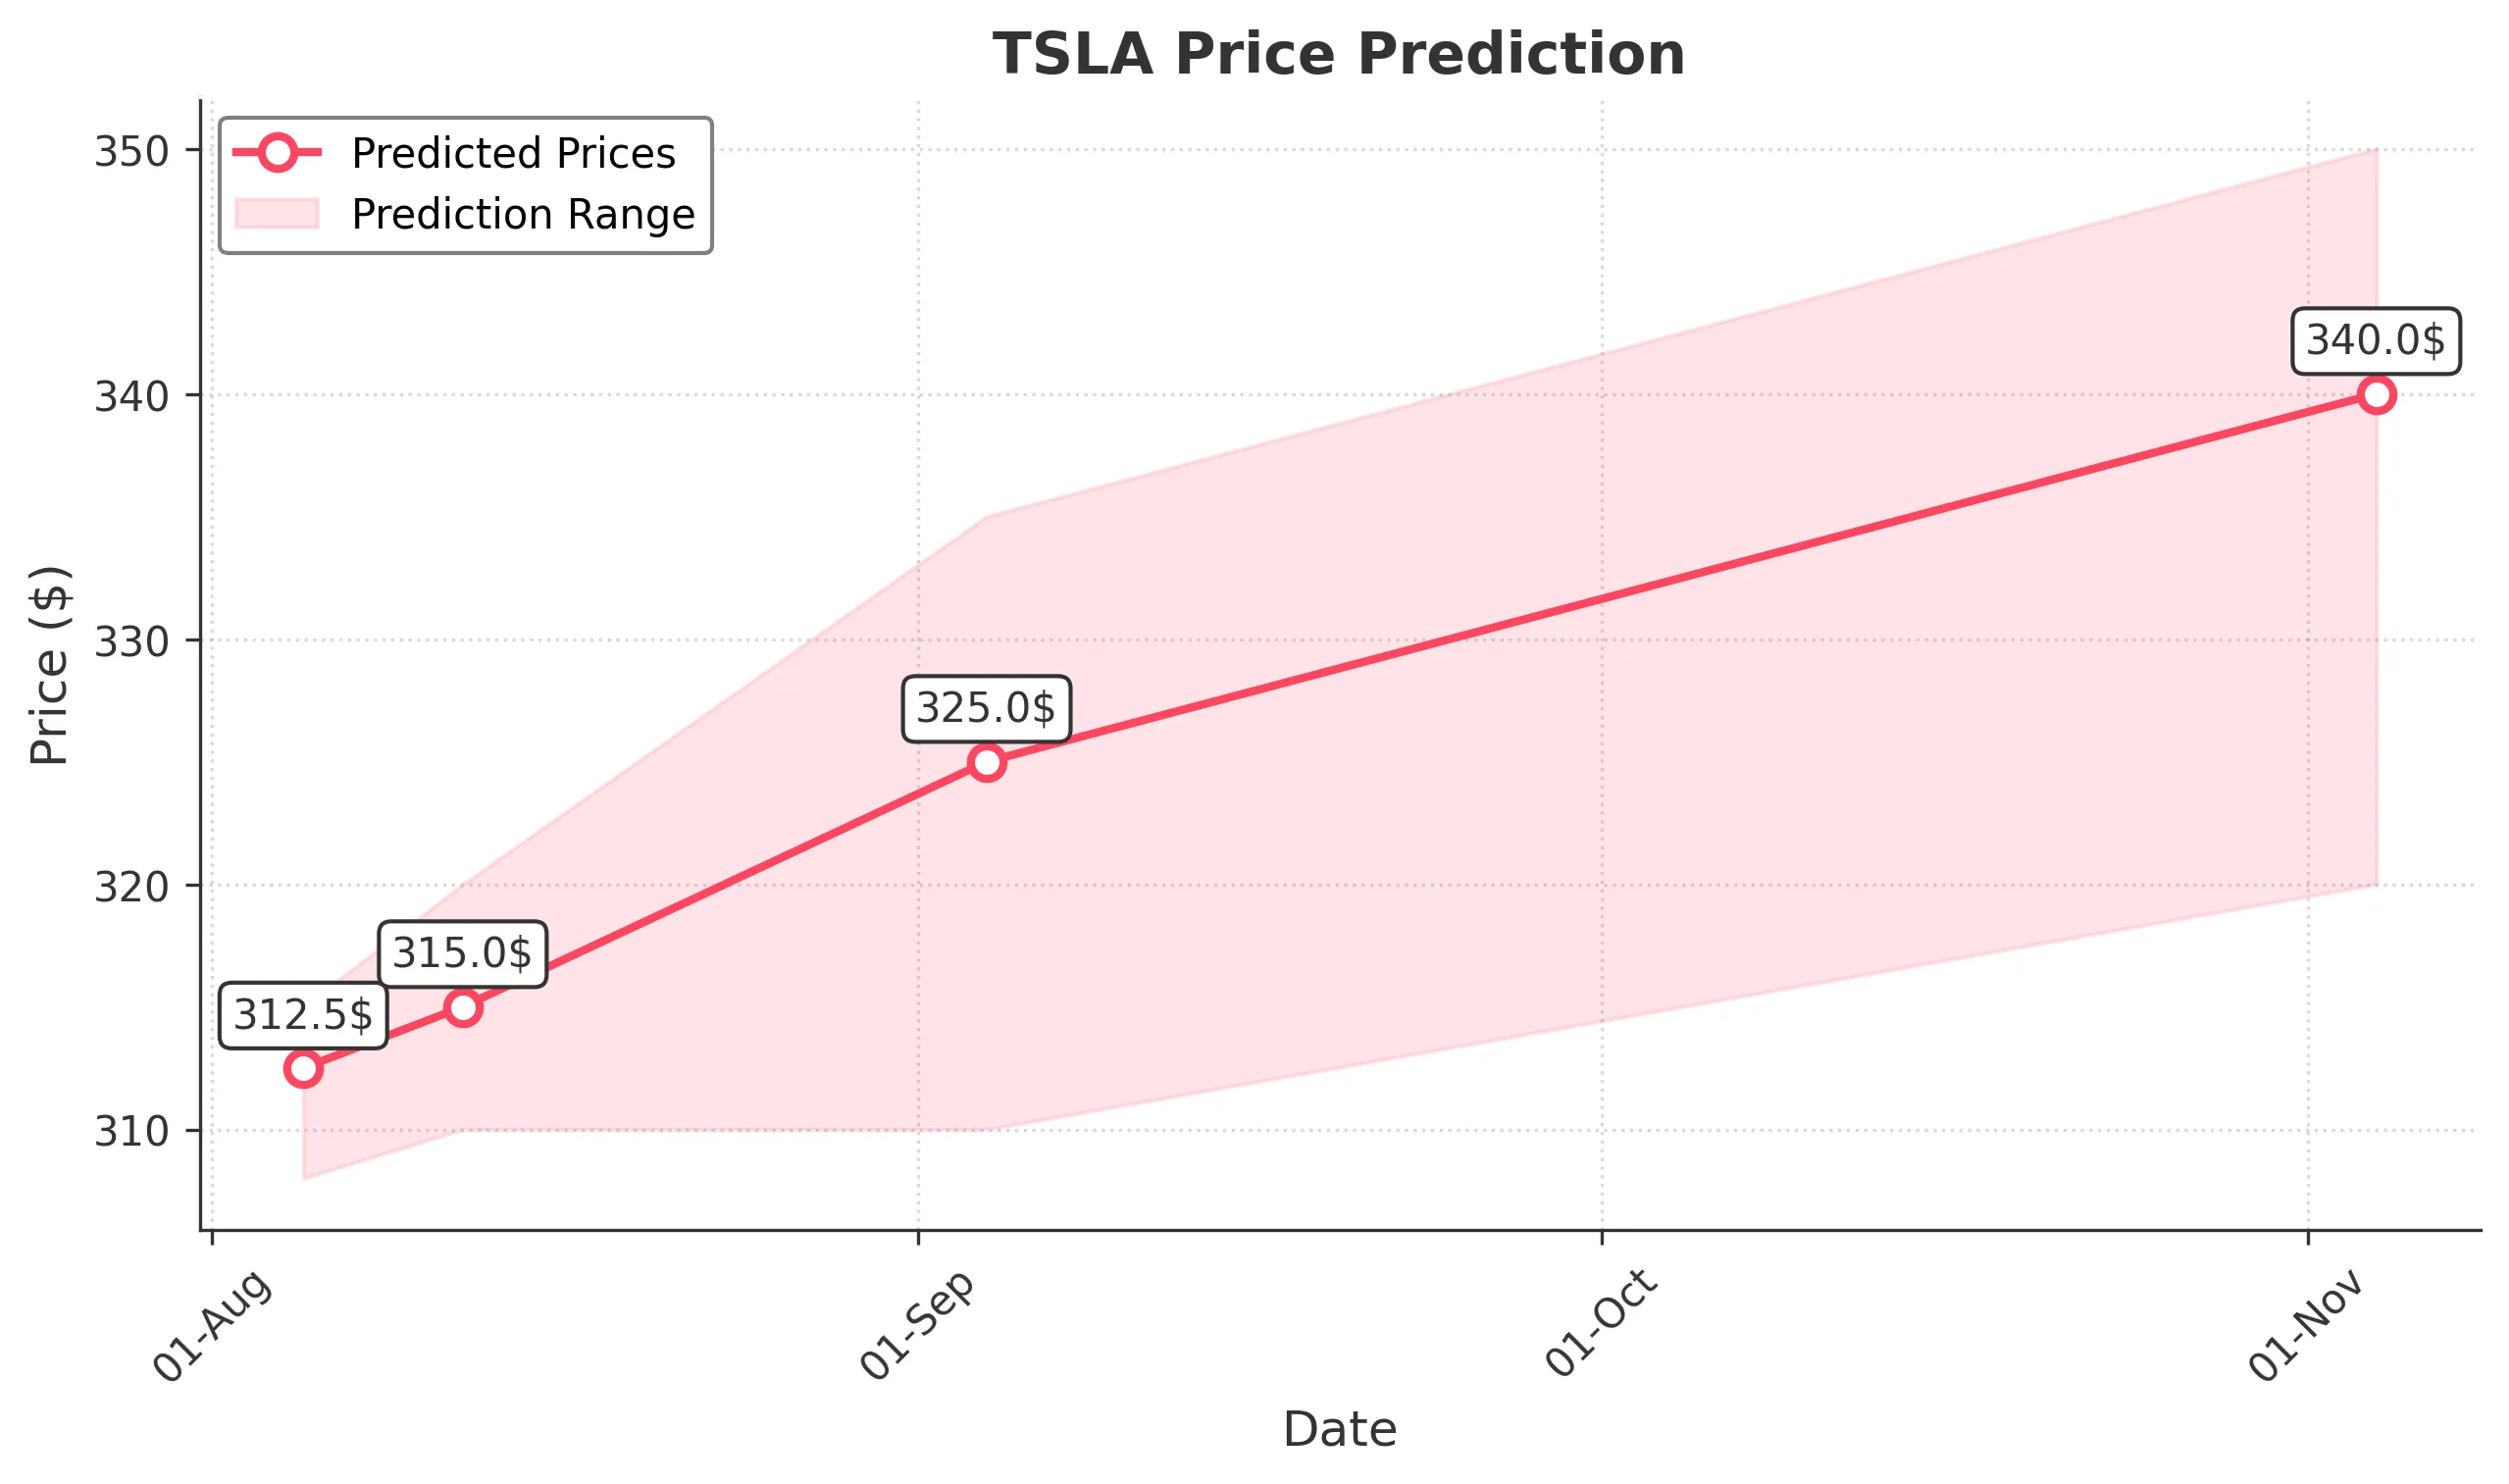
Target: August 5, 2025$312.5
$310
$315
$308
Description
The stock shows a slight bullish trend with a recent Doji candlestick indicating indecision. The RSI is near 50, suggesting a potential upward move. However, the MACD is flattening, indicating possible resistance ahead.
Analysis
Over the past 3 months, TSLA has shown significant volatility with a recent bullish trend. Key support is around $300, while resistance is near $350. The RSI indicates a neutral stance, and volume spikes suggest strong interest. Overall, the market sentiment remains mixed.
Confidence Level
Potential Risks
Market volatility and external news could impact the price. A bearish reversal is possible if the price fails to break above recent highs.
1 Week Prediction
Target: August 12, 2025$315
$312
$320
$310
Description
The stock is expected to continue its upward momentum, supported by a bullish MACD crossover. The recent price action suggests a potential breakout above resistance levels, but caution is advised due to overbought conditions.
Analysis
TSLA has experienced a bullish trend with significant price movements. The recent highs indicate strong buying interest, but the RSI suggests overbought conditions. Key support is at $310, while resistance is at $320. Market sentiment remains cautiously optimistic.
Confidence Level
Potential Risks
Potential market corrections and external economic factors could lead to price fluctuations. A failure to maintain momentum could result in a pullback.
1 Month Prediction
Target: September 4, 2025$325
$320
$335
$310
Description
The stock is likely to trend upwards, supported by strong fundamentals and positive market sentiment. However, the RSI indicates potential overbought conditions, which could lead to short-term corrections.
Analysis
In the last three months, TSLA has shown a bullish trend with significant price increases. Key support is at $310, while resistance is at $335. The MACD indicates bullish momentum, but the RSI suggests caution due to overbought conditions.
Confidence Level
Potential Risks
Economic data releases and geopolitical events could impact market sentiment. A significant pullback could occur if the stock fails to maintain upward momentum.
3 Months Prediction
Target: November 4, 2025$340
$330
$350
$320
Description
The stock is expected to maintain a bullish trend, driven by strong earnings and market sentiment. However, potential resistance at $350 may lead to volatility and corrections.
Analysis
TSLA has shown a strong upward trend over the past three months, with significant price increases. Key support is at $320, while resistance is at $350. The MACD indicates bullish momentum, but the RSI suggests caution due to potential overbought conditions.
Confidence Level
Potential Risks
Market conditions and external factors could lead to unexpected price movements. A bearish reversal is possible if resistance levels hold.