TSLA Trading Predictions
1 Day Prediction
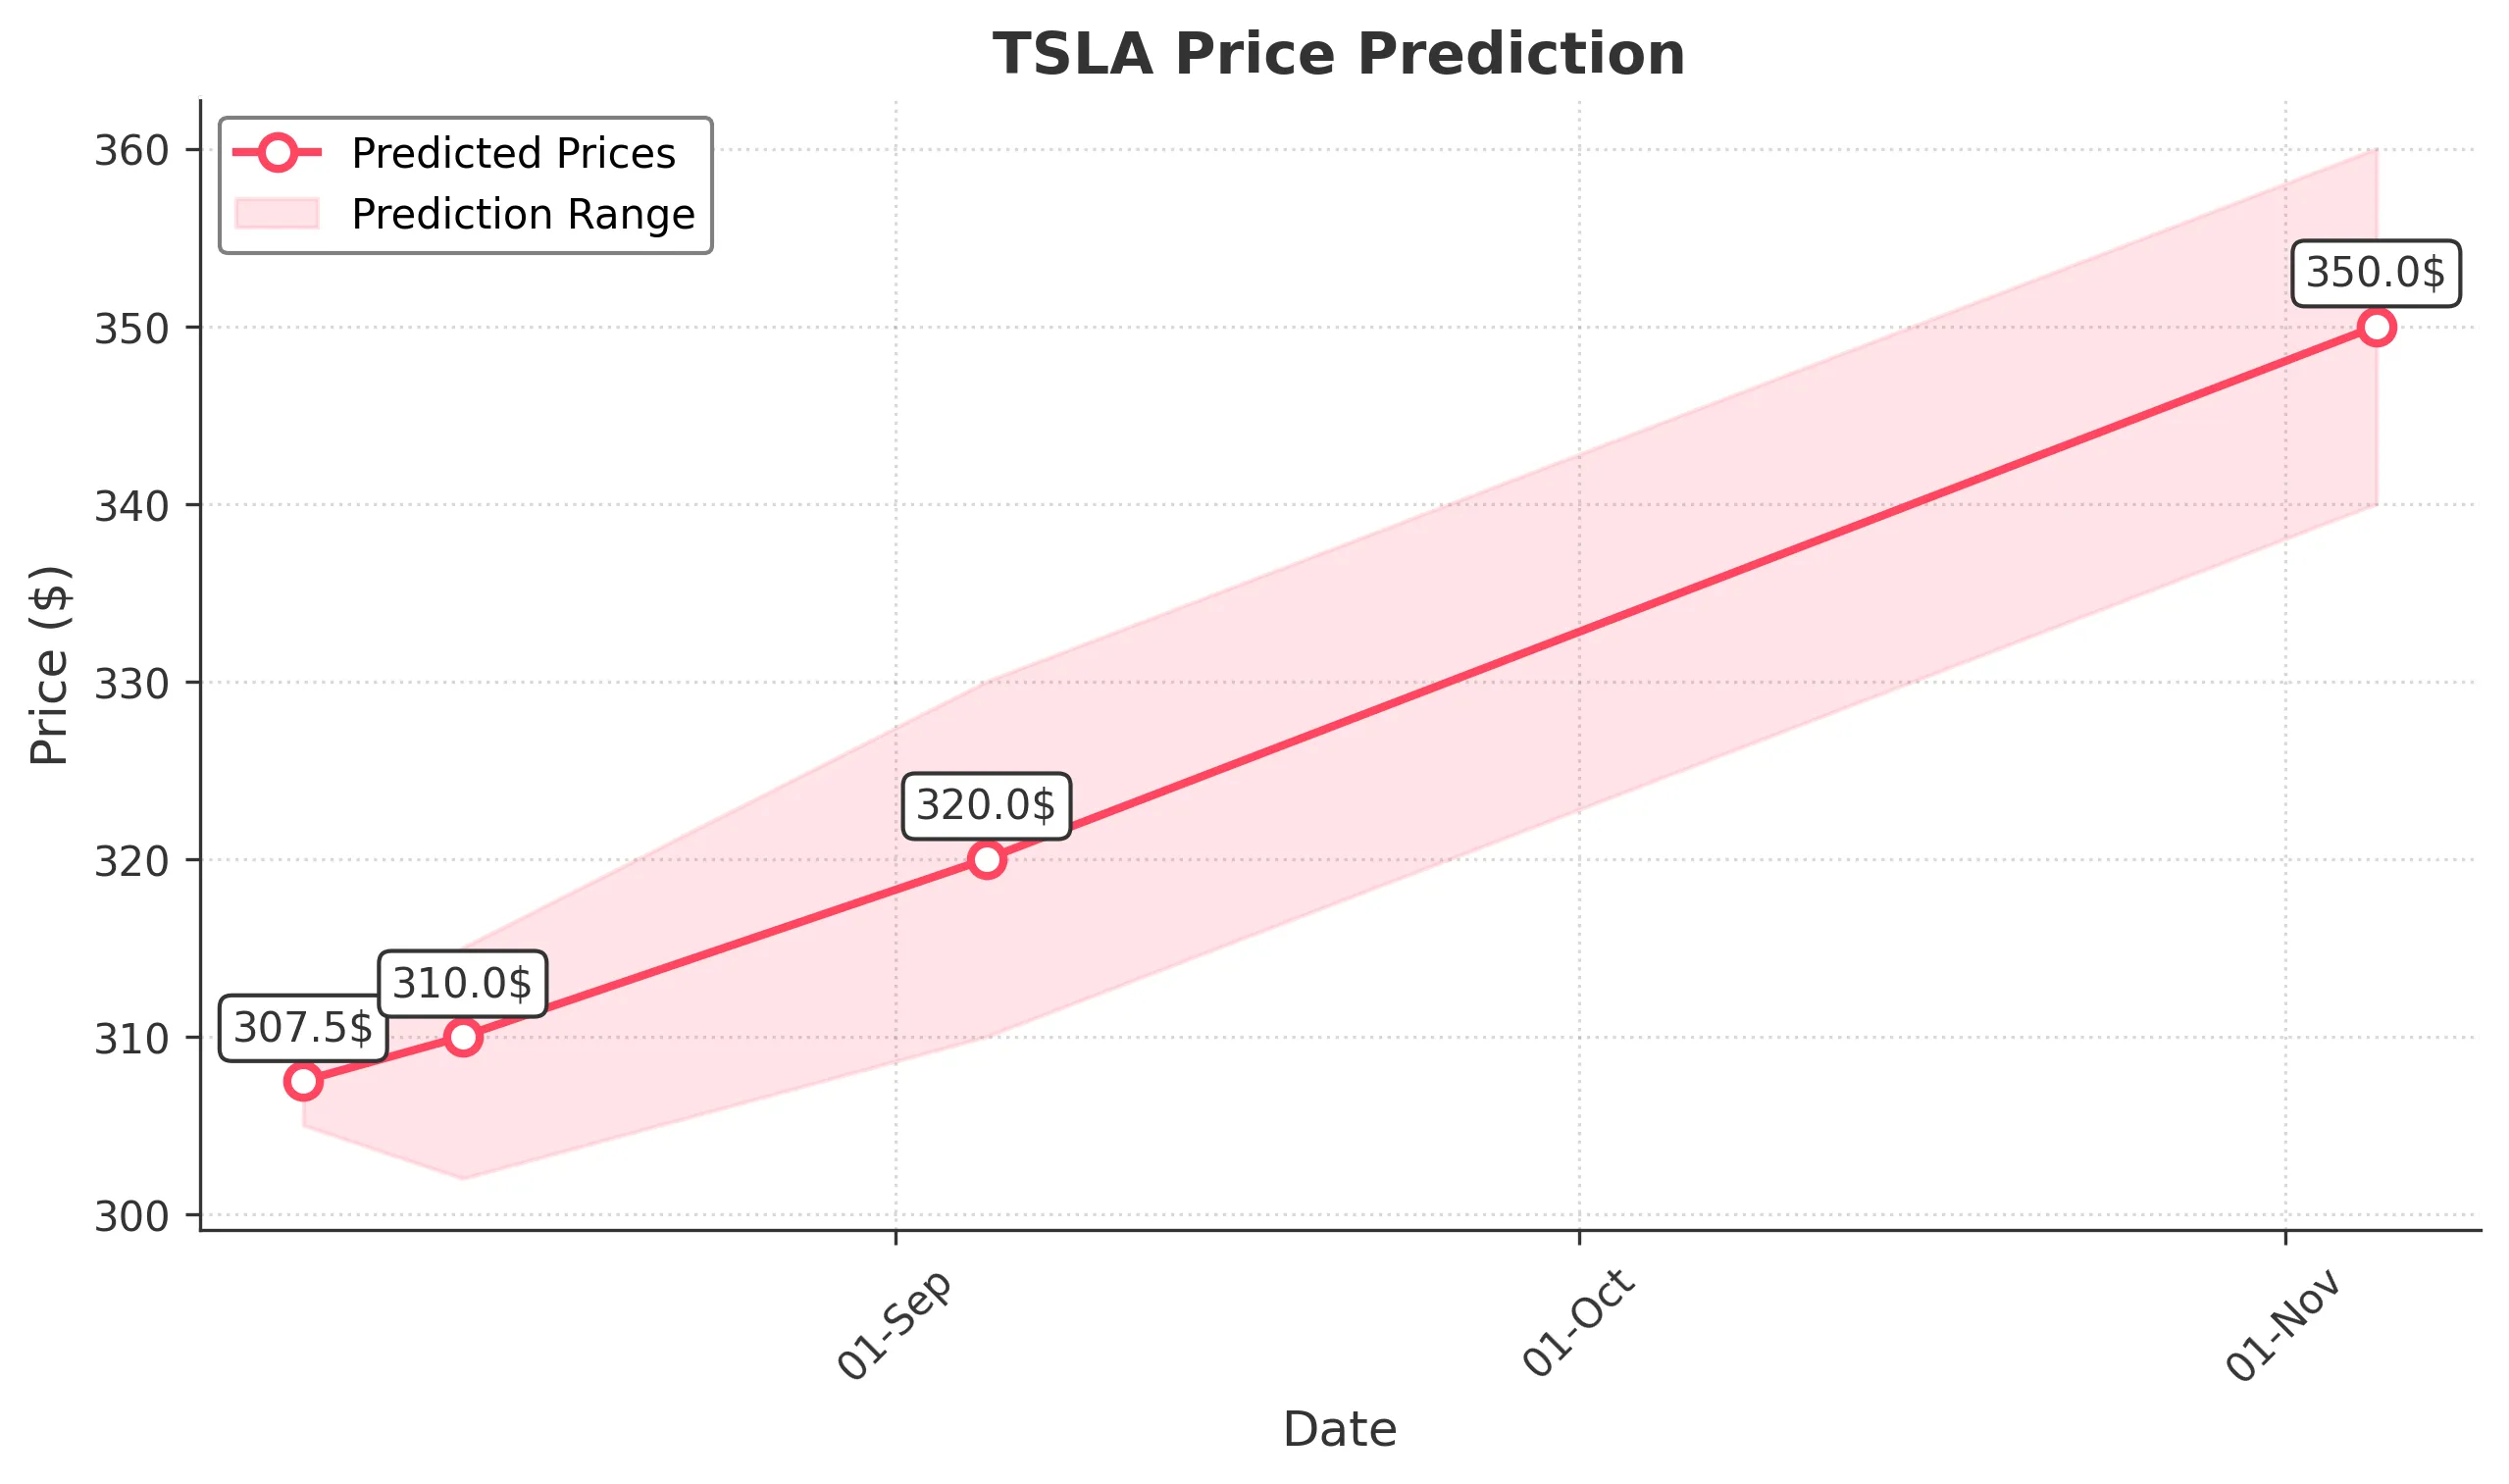
Target: August 6, 2025$307.5
$308
$310
$305
Description
The stock shows a slight bullish trend with a recent Doji candlestick indicating indecision. RSI is neutral, and MACD is close to crossing above the signal line, suggesting potential upward momentum. However, recent volatility may lead to fluctuations.
Analysis
Over the past 3 months, TSLA has shown a bearish trend recently after a peak in mid-June. Key support is around $300, while resistance is near $350. Volume has been inconsistent, with spikes indicating potential reversals. Technical indicators suggest caution.
Confidence Level
Potential Risks
Market sentiment could shift due to external news or earnings reports, which may impact the prediction.
1 Week Prediction
Target: August 13, 2025$310
$308.5
$315
$302
Description
The stock may recover slightly as it approaches a Fibonacci retracement level at $310. The MACD shows potential bullish divergence, while the RSI is nearing oversold territory, indicating a possible bounce back.
Analysis
TSLA has been in a bearish phase recently, with significant support at $300. The stock's performance has been influenced by macroeconomic factors and market sentiment. Technical indicators suggest a potential short-term recovery, but risks remain.
Confidence Level
Potential Risks
Uncertainty in market conditions and potential earnings announcements could lead to unexpected volatility.
1 Month Prediction
Target: September 5, 2025$320
$315
$330
$310
Description
A gradual recovery is expected as the stock approaches key support levels. The RSI may stabilize, and MACD could indicate a bullish crossover. However, external market factors could still pose risks.
Analysis
The past three months have shown a bearish trend, with significant fluctuations. Key support at $300 and resistance at $350 are critical. Volume patterns indicate potential accumulation, but caution is advised due to external influences.
Confidence Level
Potential Risks
Market volatility and economic indicators could impact the stock's recovery trajectory.
3 Months Prediction
Target: November 5, 2025$350
$345
$360
$340
Description
If the bullish trend continues, TSLA could reach $350, supported by positive market sentiment and potential product announcements. However, macroeconomic factors may still create headwinds.
Analysis
TSLA's performance has been volatile, with a recent bearish trend. Key support at $300 and resistance at $350 are crucial. Technical indicators suggest potential recovery, but external factors could lead to significant price swings.
Confidence Level
Potential Risks
Long-term predictions are uncertain due to potential market corrections and economic shifts.