TSLA Trading Predictions
1 Day Prediction
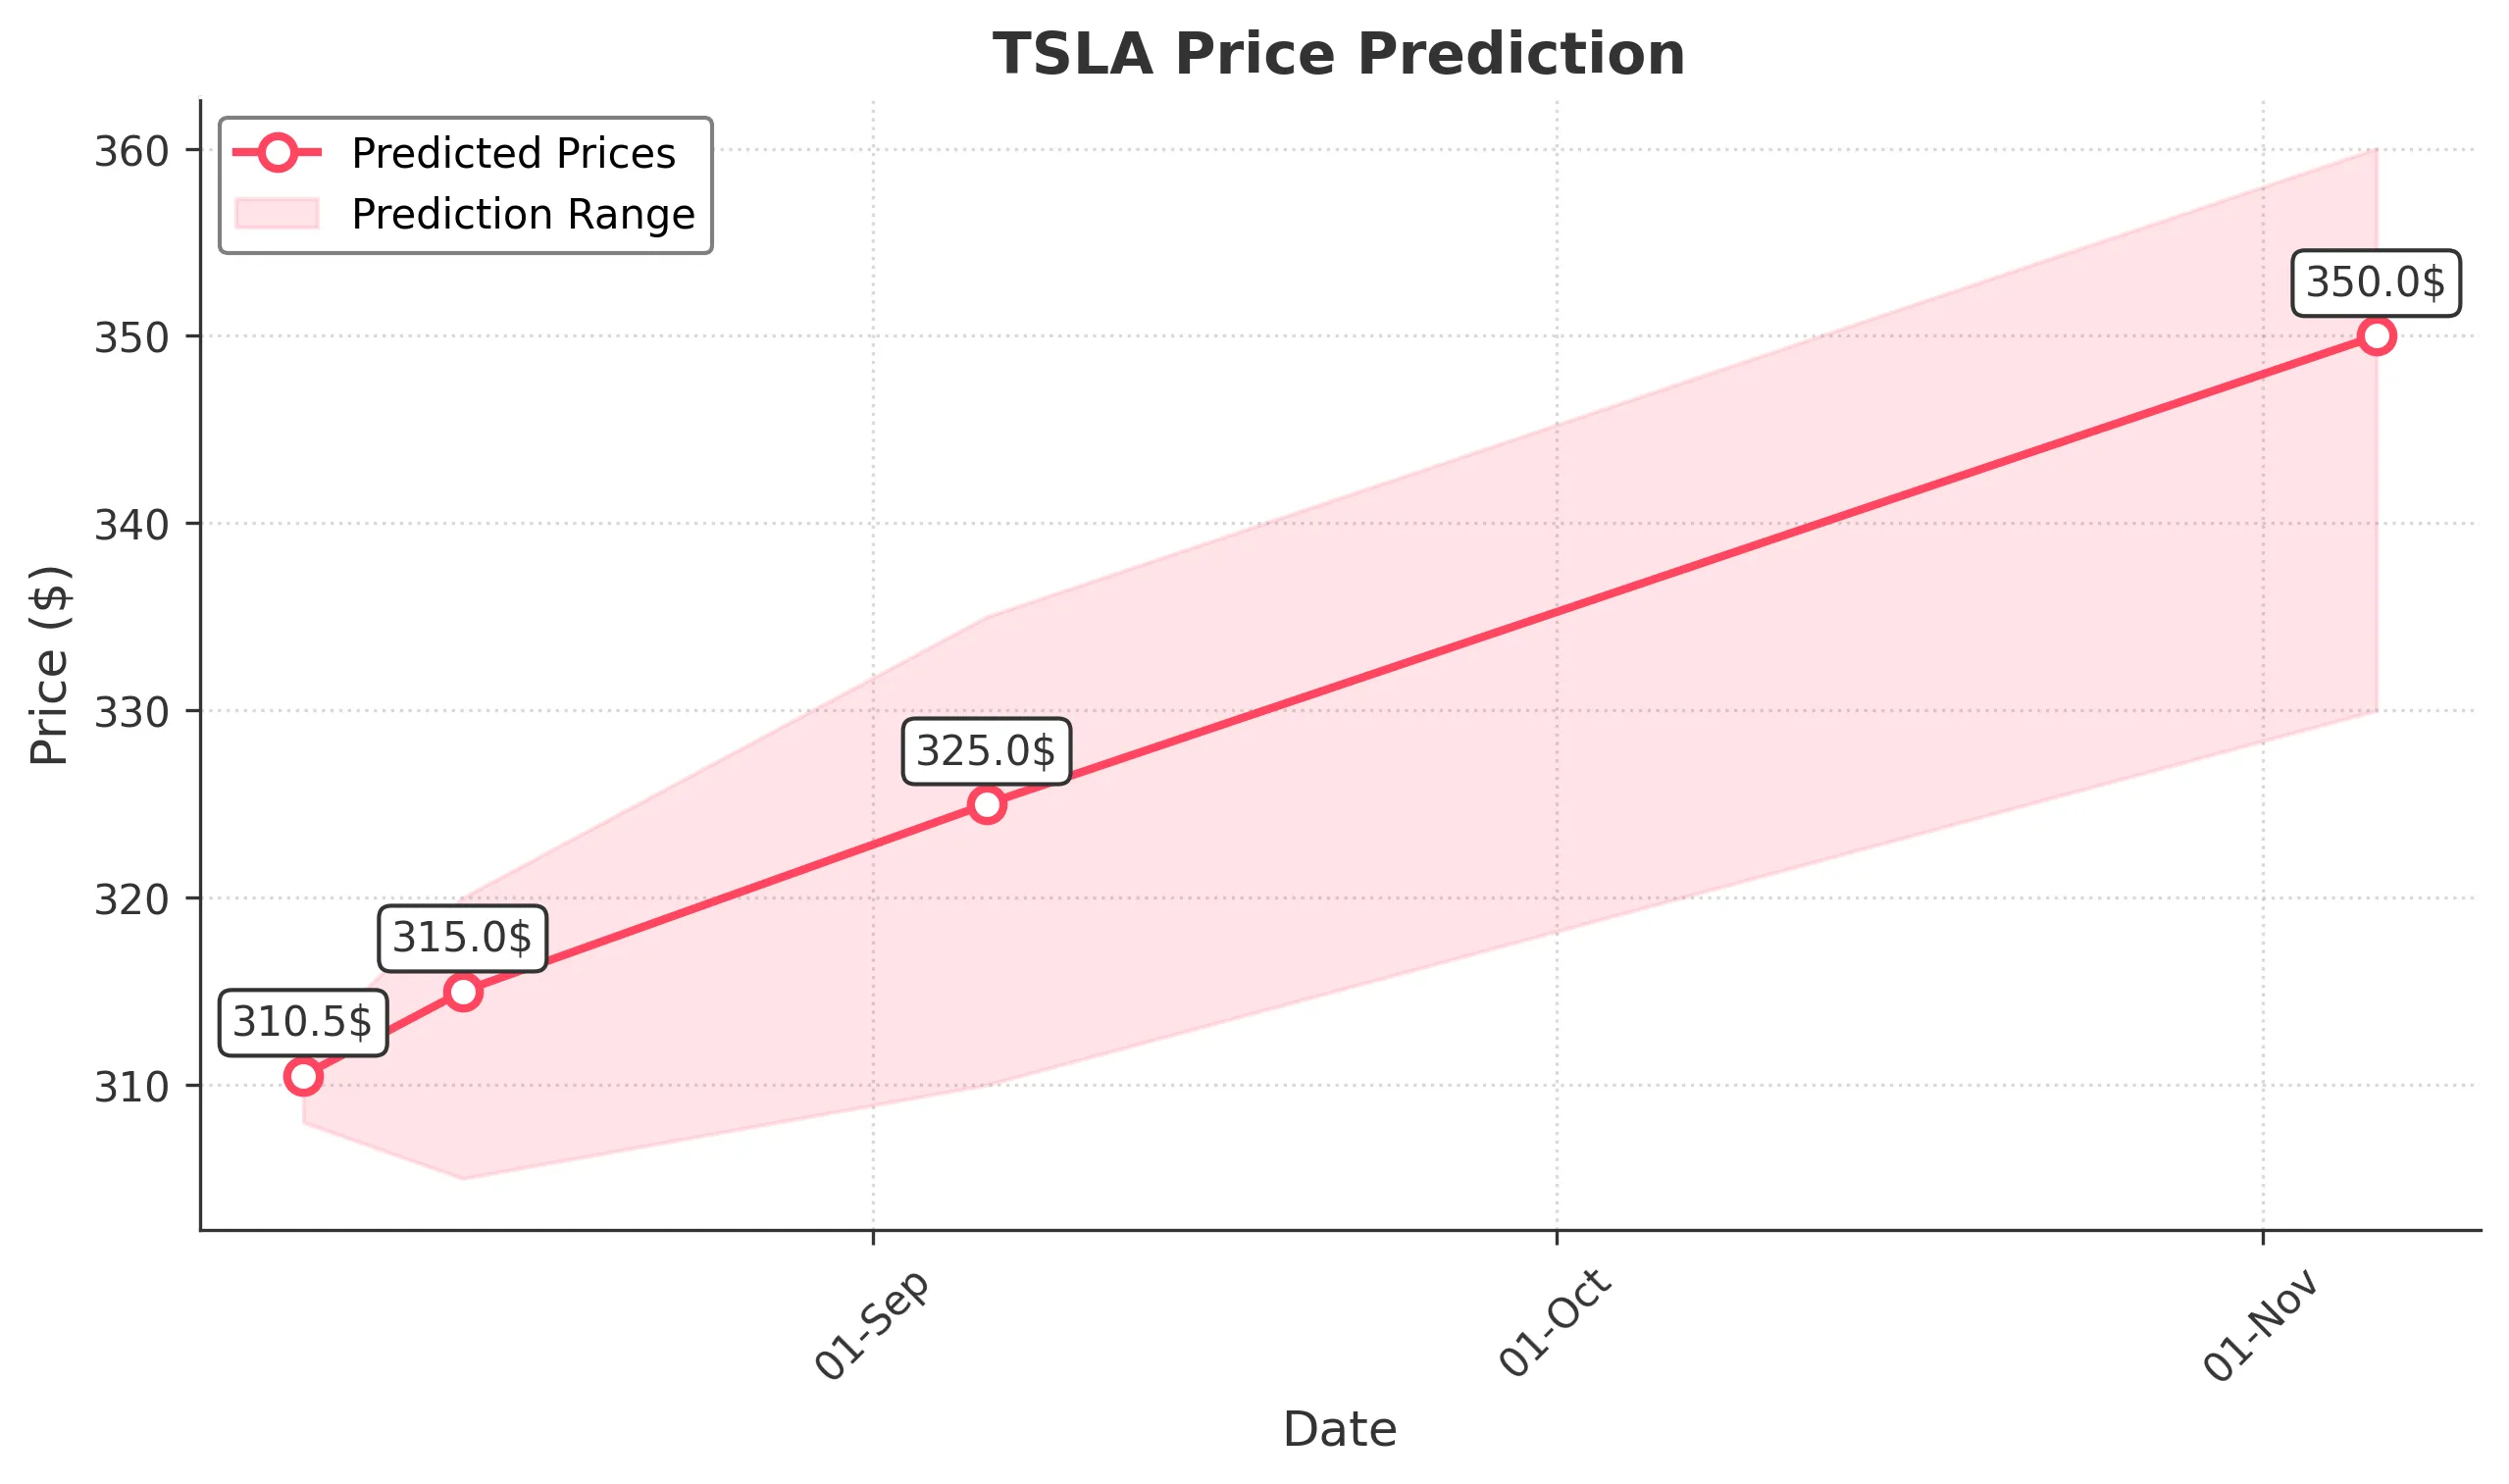
Target: August 7, 2025$310.5
$310
$312
$308
Description
The stock shows a slight bullish trend with a recent Doji candlestick indicating indecision. RSI is neutral, and MACD is close to crossing above the signal line, suggesting potential upward momentum. However, recent volatility may lead to fluctuations.
Analysis
Over the past 3 months, TSLA has shown significant volatility, with a recent peak around $362.89. The stock has retraced to around $310, indicating a potential support level. Moving averages suggest a sideways trend, while volume spikes indicate investor interest.
Confidence Level
Potential Risks
Market sentiment could shift due to external news or earnings reports, which may impact the prediction.
1 Week Prediction
Target: August 14, 2025$315
$310.5
$320
$305
Description
The stock is expected to recover slightly as bullish sentiment builds. The MACD shows potential for upward movement, and the RSI is approaching oversold territory. However, resistance at $320 may limit gains.
Analysis
TSLA has experienced a bearish phase recently, with significant price drops. Key support levels are around $305, while resistance is at $320. The stock's volatility remains high, and external factors could influence future performance.
Confidence Level
Potential Risks
Potential market corrections or negative news could reverse the trend, impacting the accuracy of this prediction.
1 Month Prediction
Target: September 6, 2025$325
$315
$335
$310
Description
A gradual recovery is anticipated as the stock stabilizes. The RSI may indicate a bullish divergence, and the MACD could confirm upward momentum. However, resistance at $335 may pose challenges.
Analysis
The past three months have shown a bearish trend with significant price fluctuations. Key support is at $310, while resistance is at $335. Technical indicators suggest a potential recovery, but external factors could impact performance.
Confidence Level
Potential Risks
Market volatility and macroeconomic factors could lead to unexpected price movements, affecting the prediction's reliability.
3 Months Prediction
Target: November 6, 2025$350
$340
$360
$330
Description
Long-term bullish sentiment may prevail as the stock approaches key Fibonacci retracement levels. The MACD and RSI indicate potential upward momentum, but market conditions could introduce volatility.
Analysis
TSLA's performance over the last three months has been marked by volatility and significant price swings. The stock is currently at a critical juncture, with support around $330 and resistance at $360. Technical indicators suggest a potential bullish reversal, but external factors must be monitored.
Confidence Level
Potential Risks
Unforeseen macroeconomic events or changes in market sentiment could impact the stock's trajectory, introducing risks to the prediction.