TSLA Trading Predictions
1 Day Prediction
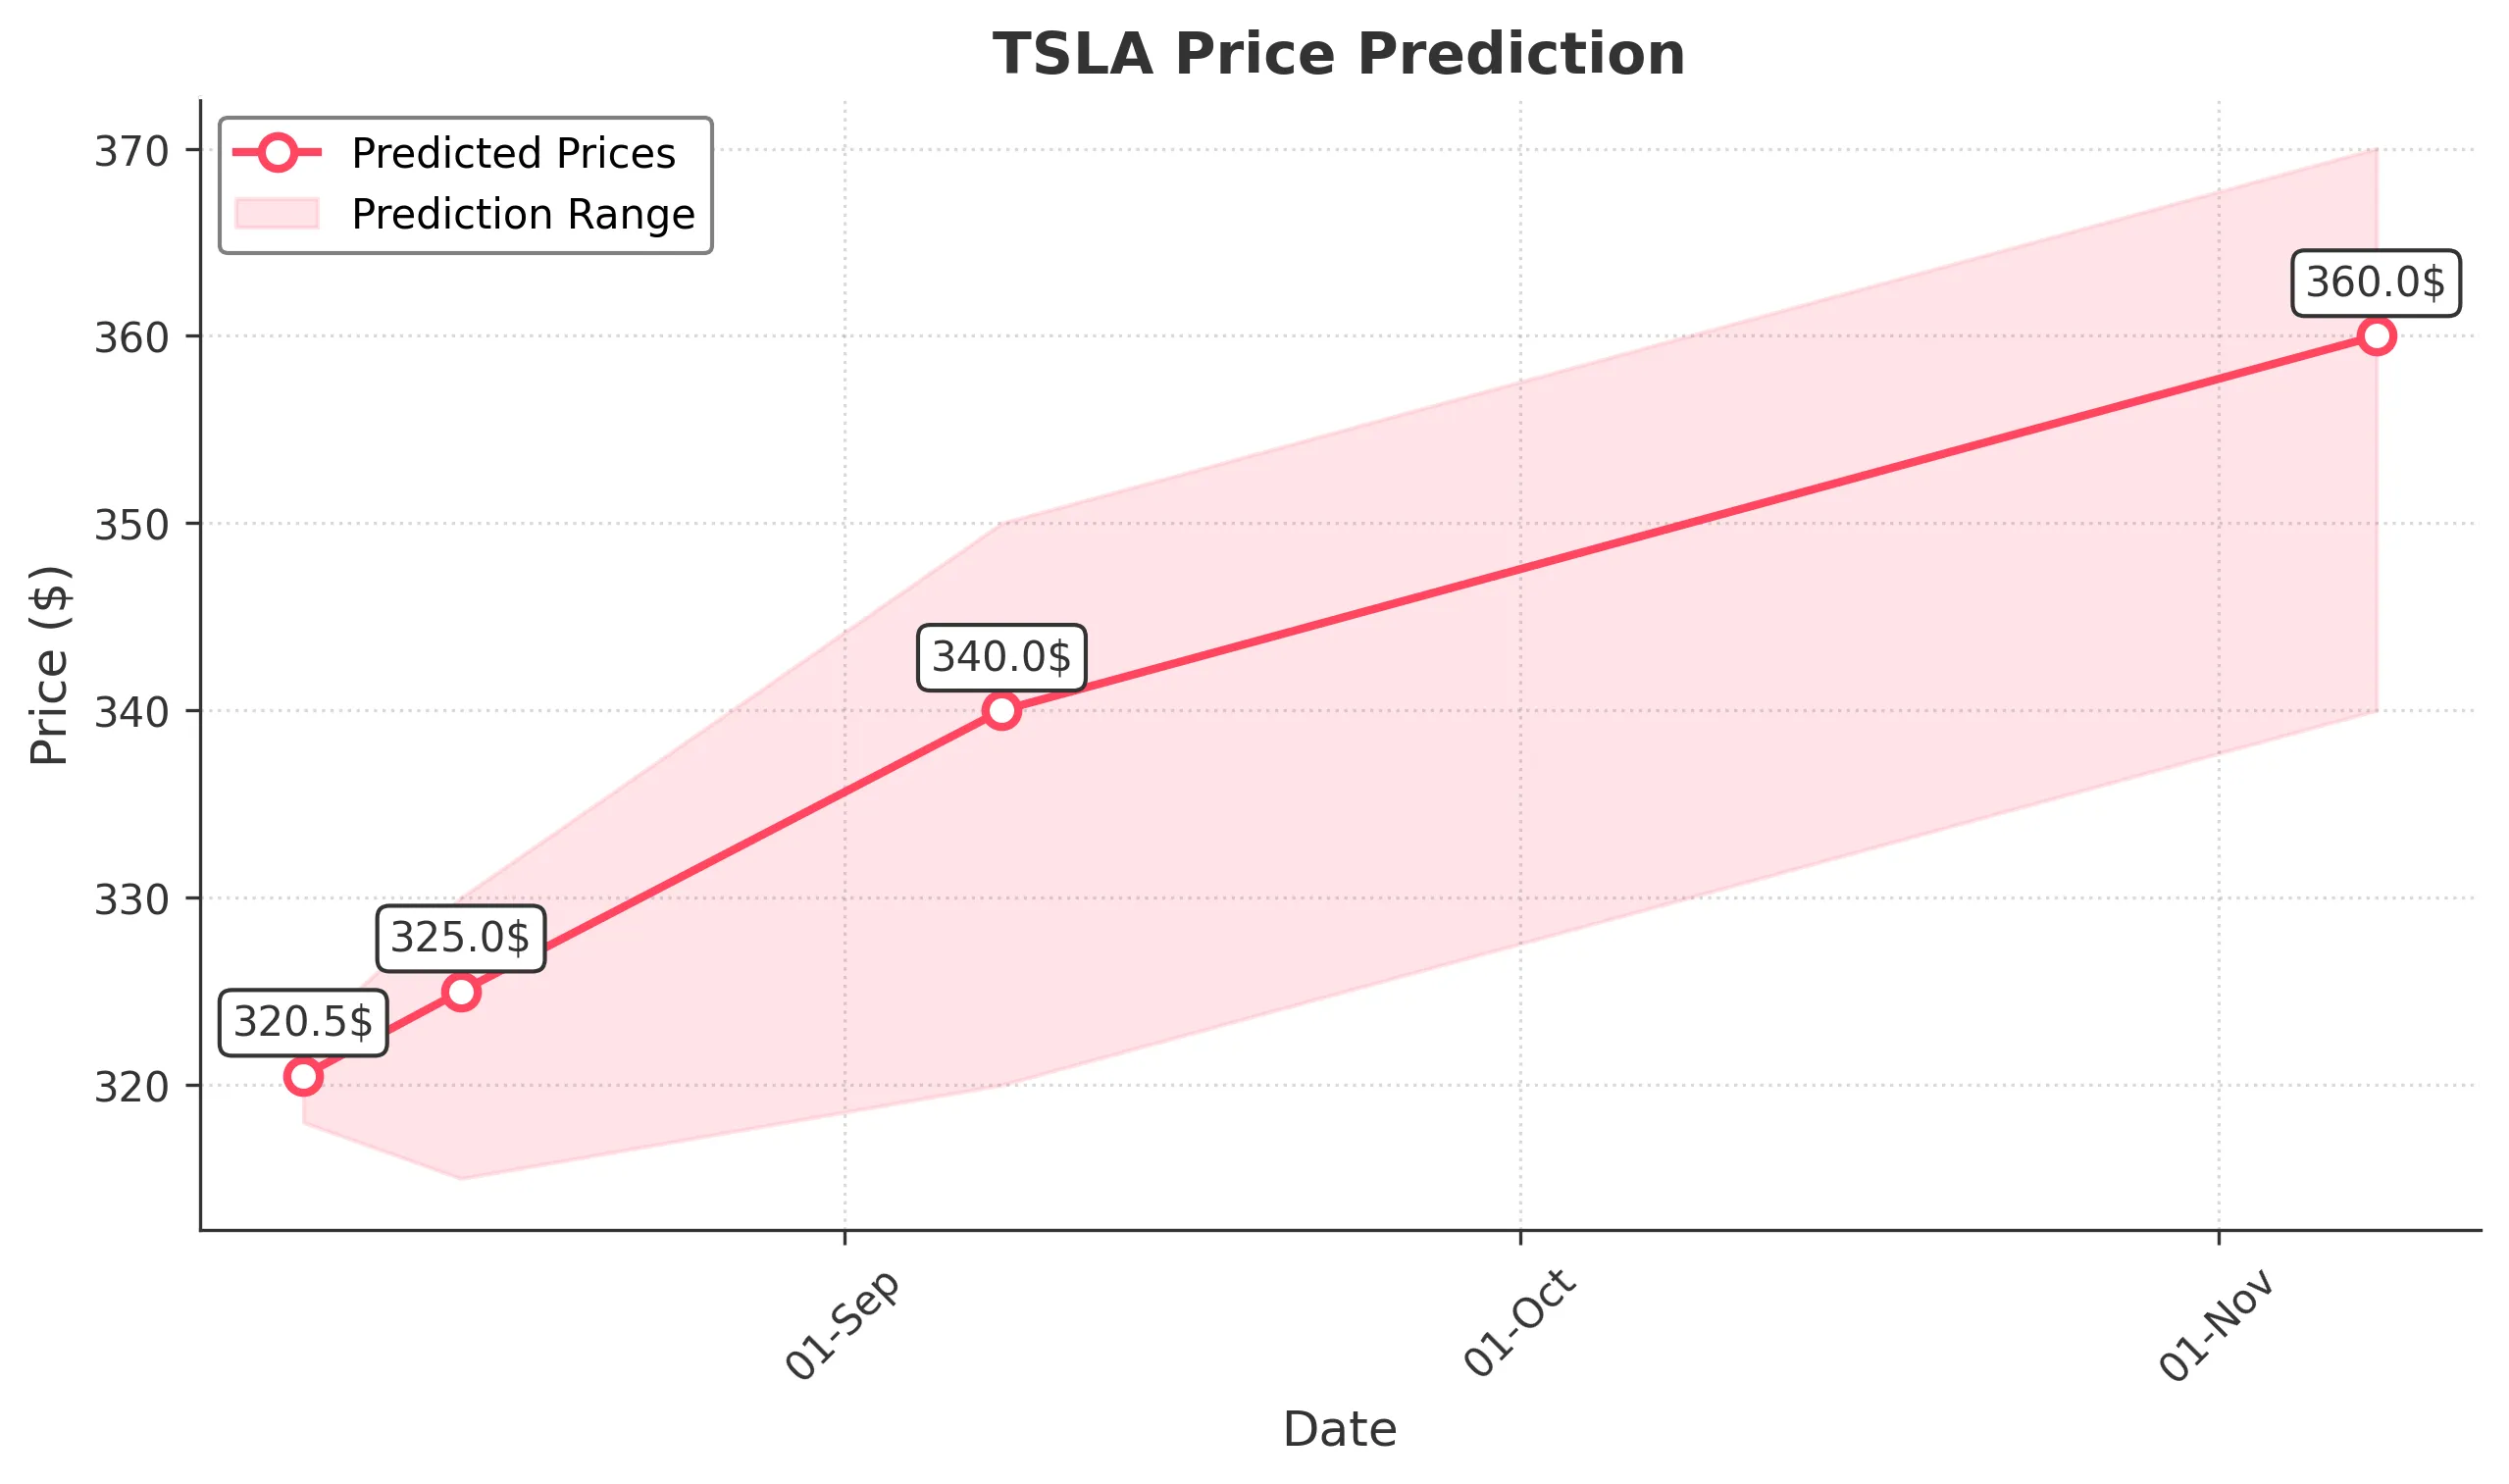
Target: August 8, 2025$320.5
$319
$322.5
$318
Description
The stock shows a slight bullish trend with a recent Doji pattern indicating indecision. RSI is neutral, and MACD is close to crossing above the signal line, suggesting potential upward momentum. However, volatility remains a concern.
Analysis
Over the past 3 months, TSLA has shown volatility with significant price swings. Key support is around $300, while resistance is near $350. Recent volume spikes indicate strong interest, but the overall trend is mixed with both bullish and bearish signals.
Confidence Level
Potential Risks
Market sentiment could shift due to external news or earnings reports, which may impact the prediction.
1 Week Prediction
Target: August 15, 2025$325
$320
$330
$315
Description
The stock is expected to rise as bullish sentiment builds. The MACD shows a potential bullish crossover, and the RSI is approaching overbought territory. However, a pullback could occur if resistance at $330 holds.
Analysis
TSLA has been fluctuating between $300 and $350, with recent bullish patterns emerging. The average volume indicates strong trading activity, and the ATR suggests increased volatility. Key resistance at $330 may limit further gains.
Confidence Level
Potential Risks
Potential market corrections or negative news could reverse the upward trend.
1 Month Prediction
Target: September 8, 2025$340
$335
$350
$320
Description
A bullish trend is anticipated as the stock approaches key Fibonacci retracement levels. The MACD remains positive, and the RSI indicates strength. However, profit-taking could lead to short-term corrections.
Analysis
The past three months show a recovery from lows, with TSLA testing resistance levels. The stock has been supported by strong volume, and technical indicators suggest a bullish outlook, but caution is warranted due to potential market fluctuations.
Confidence Level
Potential Risks
Market volatility and external economic factors could impact the stock's performance.
3 Months Prediction
Target: November 8, 2025$360
$355
$370
$340
Description
Long-term bullish sentiment is expected as the stock breaks through resistance levels. The MACD and RSI indicate strong momentum, but external factors could introduce volatility.
Analysis
TSLA has shown resilience with a bullish trend over the last three months. Key support is at $320, while resistance is at $350. The stock's performance is influenced by broader market trends and investor sentiment, which remain mixed.
Confidence Level
Potential Risks
Unforeseen macroeconomic events or changes in market sentiment could lead to price corrections.