TSLA Trading Predictions
1 Day Prediction
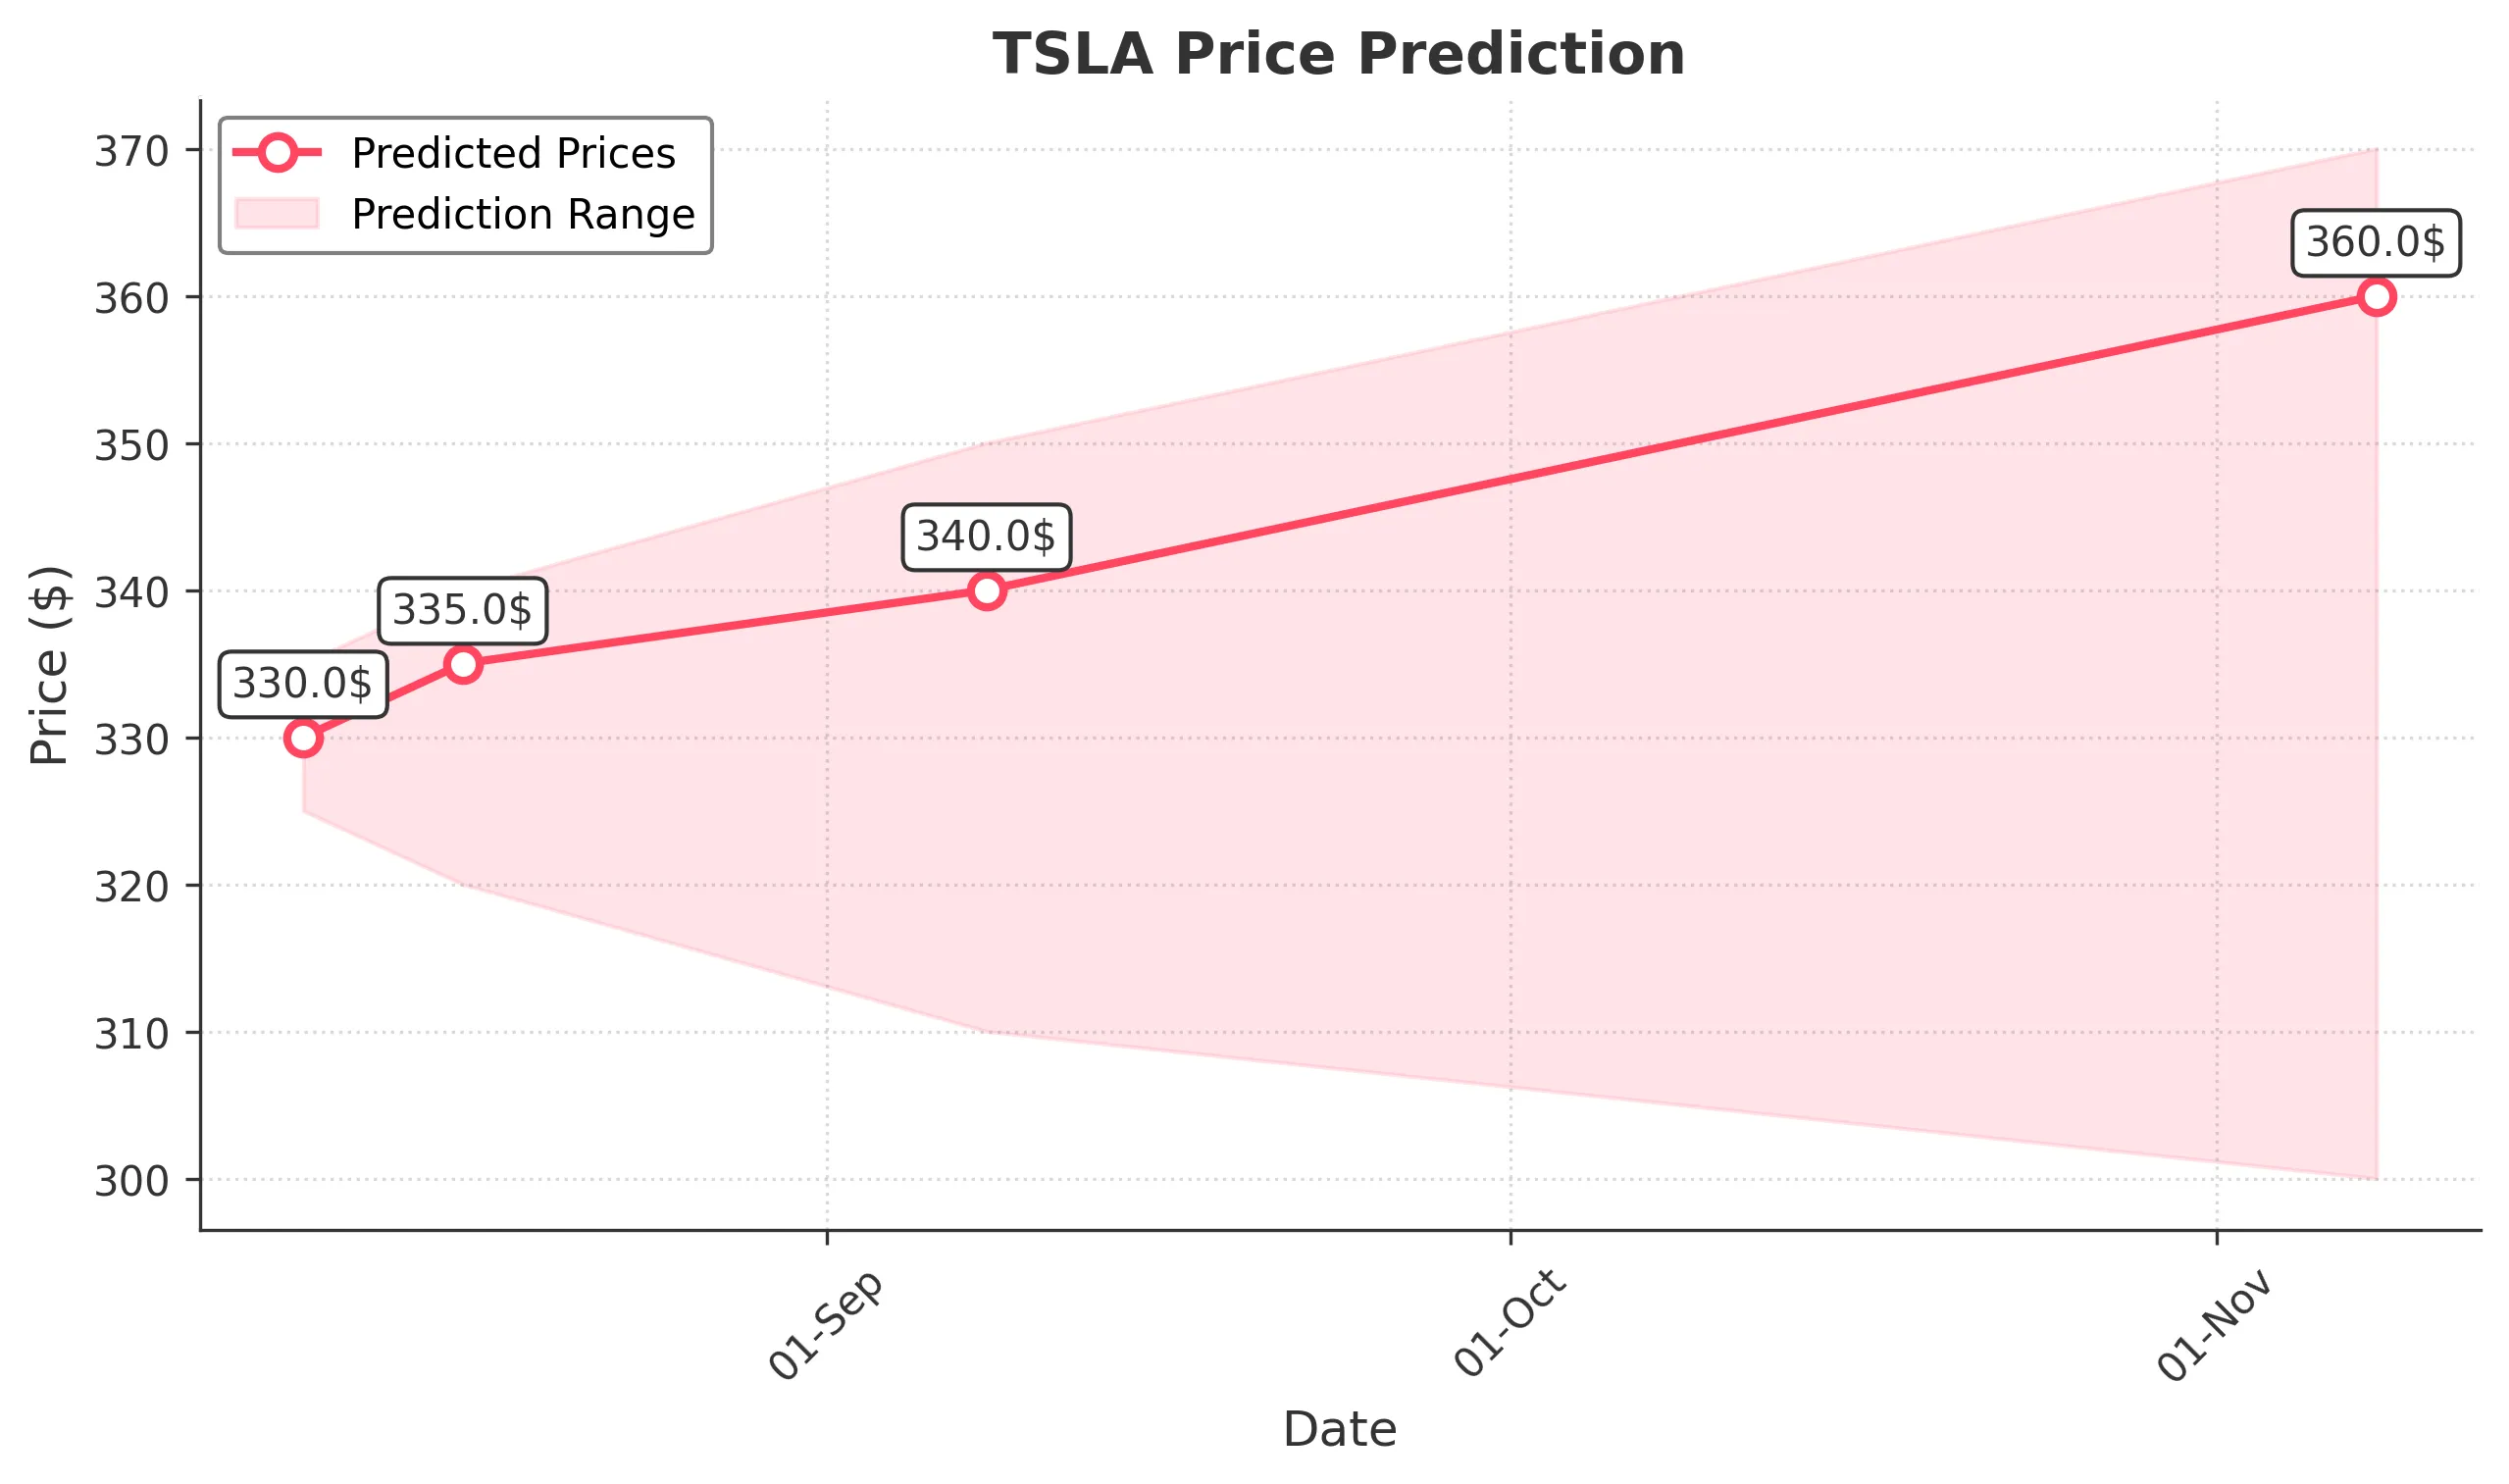
Target: August 9, 2025$330
$328
$335
$325
Description
The stock shows bullish momentum with a recent upward trend. The RSI is approaching overbought levels, indicating potential for a pullback. However, strong support at $325 and positive market sentiment may drive the price higher.
Analysis
Over the past 3 months, TSLA has shown a bullish trend with significant price increases. Key support at $325 and resistance around $350. Volume spikes indicate strong buying interest. Recent candlestick patterns suggest bullish continuation, but RSI nearing overbought levels raises caution.
Confidence Level
Potential Risks
Potential for a reversal if market sentiment shifts or if macroeconomic news impacts investor confidence.
1 Week Prediction
Target: August 16, 2025$335
$330
$340
$320
Description
The upward trend is expected to continue, supported by recent bullish candlestick patterns. However, the RSI indicates potential overbought conditions, suggesting a possible pullback. Market sentiment remains positive, but caution is advised.
Analysis
TSLA has experienced a strong bullish phase, with significant price gains. The recent high volume indicates strong buying interest. Key resistance at $340 may limit further upside, while support at $320 is crucial for maintaining the upward trend.
Confidence Level
Potential Risks
Market volatility and external economic factors could lead to unexpected price movements.
1 Month Prediction
Target: September 8, 2025$340
$335
$350
$310
Description
Expect continued bullish momentum, but with increased volatility. The MACD shows a bullish crossover, and Fibonacci retracement levels suggest potential resistance at $350. Market sentiment remains strong, but caution is warranted.
Analysis
The stock has shown a strong upward trend, with key support at $310 and resistance at $350. The MACD indicates bullish momentum, but the RSI suggests overbought conditions. Volume patterns indicate strong interest, but external factors could introduce volatility.
Confidence Level
Potential Risks
Potential for market corrections or negative news impacting stock performance.
3 Months Prediction
Target: November 8, 2025$360
$350
$370
$300
Description
Long-term bullish outlook supported by strong fundamentals and market sentiment. However, potential resistance at $370 may limit gains. Watch for macroeconomic developments that could impact the tech sector.
Analysis
TSLA has shown a robust performance over the past three months, with a bullish trend. Key support at $300 and resistance at $370. The stock's volatility is increasing, and external economic factors could influence future performance. A balanced view is necessary as market conditions evolve.
Confidence Level
Potential Risks
Market corrections, economic downturns, or negative news could significantly impact stock performance.