TSLA Trading Predictions
1 Day Prediction
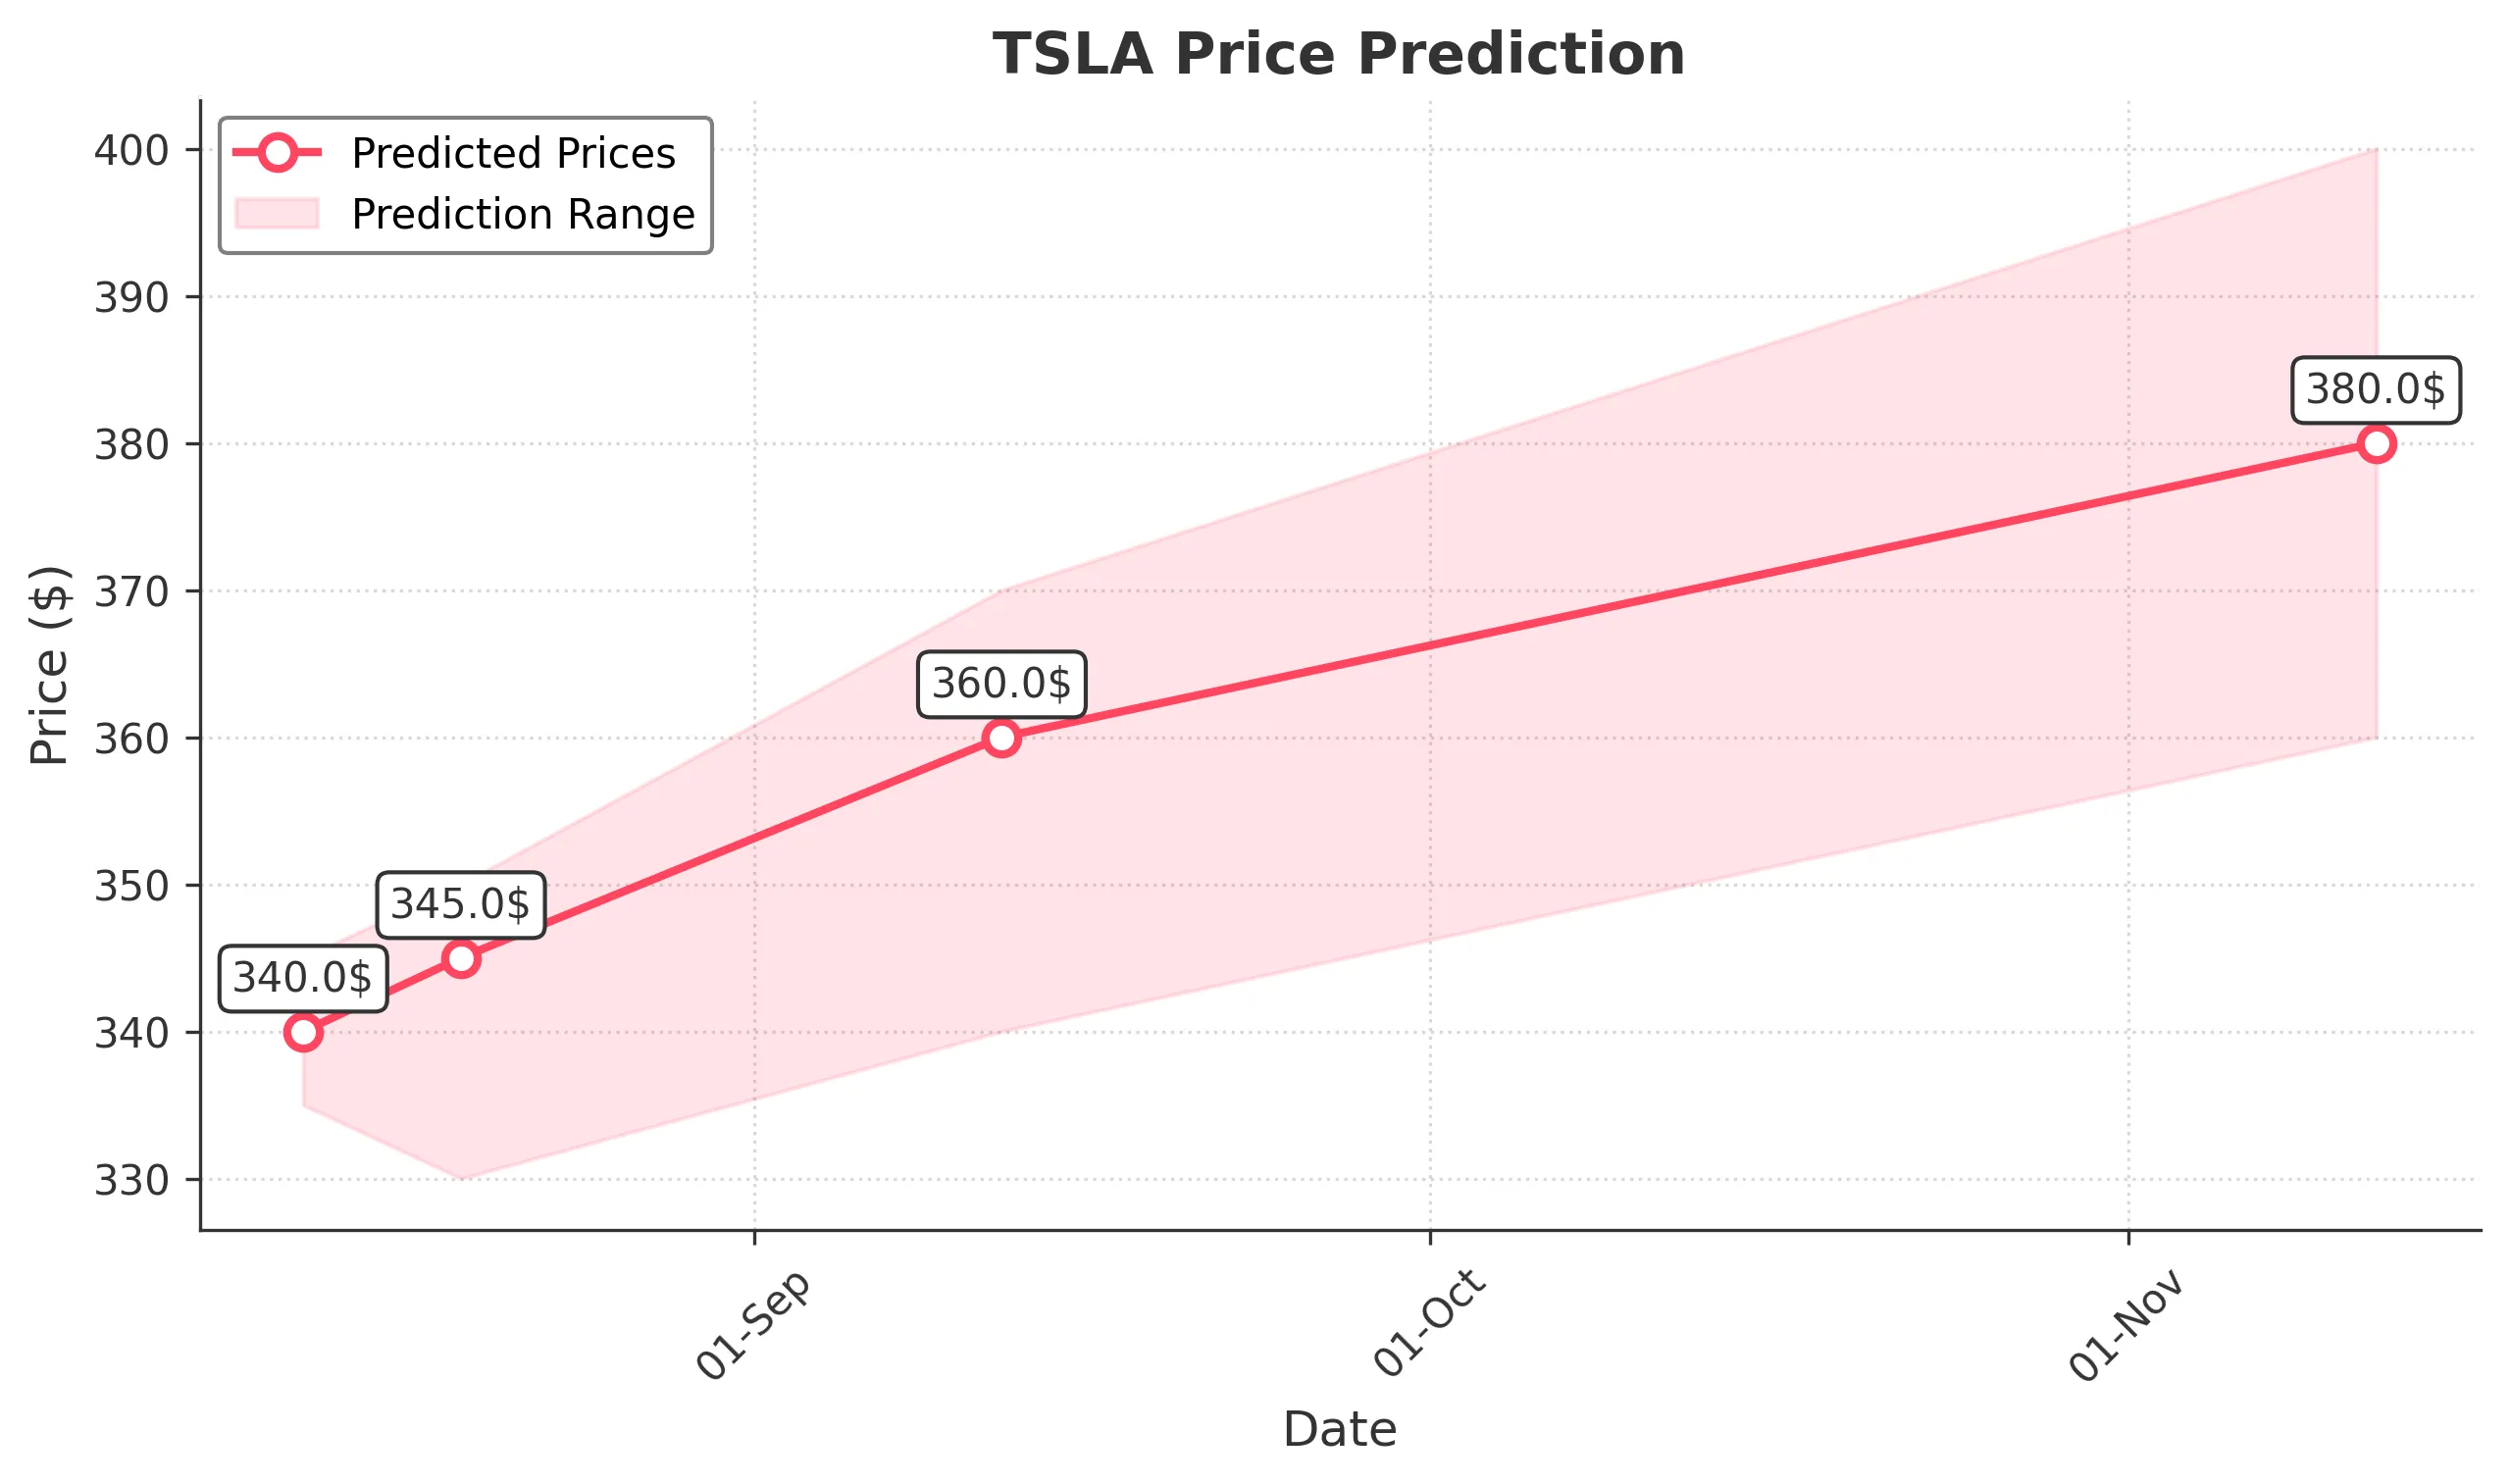
Target: August 12, 2025$340
$339
$345
$335
Description
The stock shows bullish momentum with a recent upward trend. The RSI is approaching overbought levels, indicating potential for a pullback. However, strong support at $335 may hold, leading to a slight increase in price.
Analysis
Over the past 3 months, TSLA has shown volatility with significant price swings. Key support at $300 and resistance around $350. Recent bullish candlestick patterns suggest upward momentum, but the RSI indicates overbought conditions, warranting caution.
Confidence Level
Potential Risks
Potential for a reversal exists if market sentiment shifts or if macroeconomic news impacts investor confidence.
1 Week Prediction
Target: August 19, 2025$345
$340
$350
$330
Description
The stock is expected to continue its upward trend, supported by recent bullish patterns. However, the RSI indicates potential overbought conditions, suggesting a possible pullback. Watch for volume spikes as a signal of trend strength.
Analysis
TSLA has experienced a mix of bullish and bearish trends. The recent price action shows a recovery from lows, but the high volatility and mixed volume patterns indicate uncertainty. Key resistance at $350 may limit upside potential.
Confidence Level
Potential Risks
Market volatility and external economic factors could lead to unexpected price movements, impacting the prediction.
1 Month Prediction
Target: September 12, 2025$360
$355
$370
$340
Description
Expect continued bullish momentum as the stock approaches key Fibonacci retracement levels. The MACD shows a bullish crossover, supporting upward movement. However, watch for potential resistance at $370.
Analysis
The past three months have shown a recovery from significant lows, with bullish patterns emerging. Key support at $300 and resistance at $370. The stock's volatility remains high, and external factors could influence future performance.
Confidence Level
Potential Risks
Economic data releases or changes in market sentiment could impact the stock's trajectory, leading to volatility.
3 Months Prediction
Target: November 12, 2025$380
$375
$400
$360
Description
Long-term bullish outlook as the stock may break through resistance levels. The overall trend is positive, supported by strong fundamentals. However, macroeconomic factors could introduce volatility.
Analysis
TSLA's performance has been characterized by significant volatility and recovery from lows. The stock is currently in a bullish phase, with key support at $340 and resistance at $400. Market sentiment remains cautiously optimistic, but external factors could introduce risks.
Confidence Level
Potential Risks
Unforeseen economic events or changes in market sentiment could lead to price corrections, impacting the prediction's accuracy.