TSLA Trading Predictions
1 Day Prediction
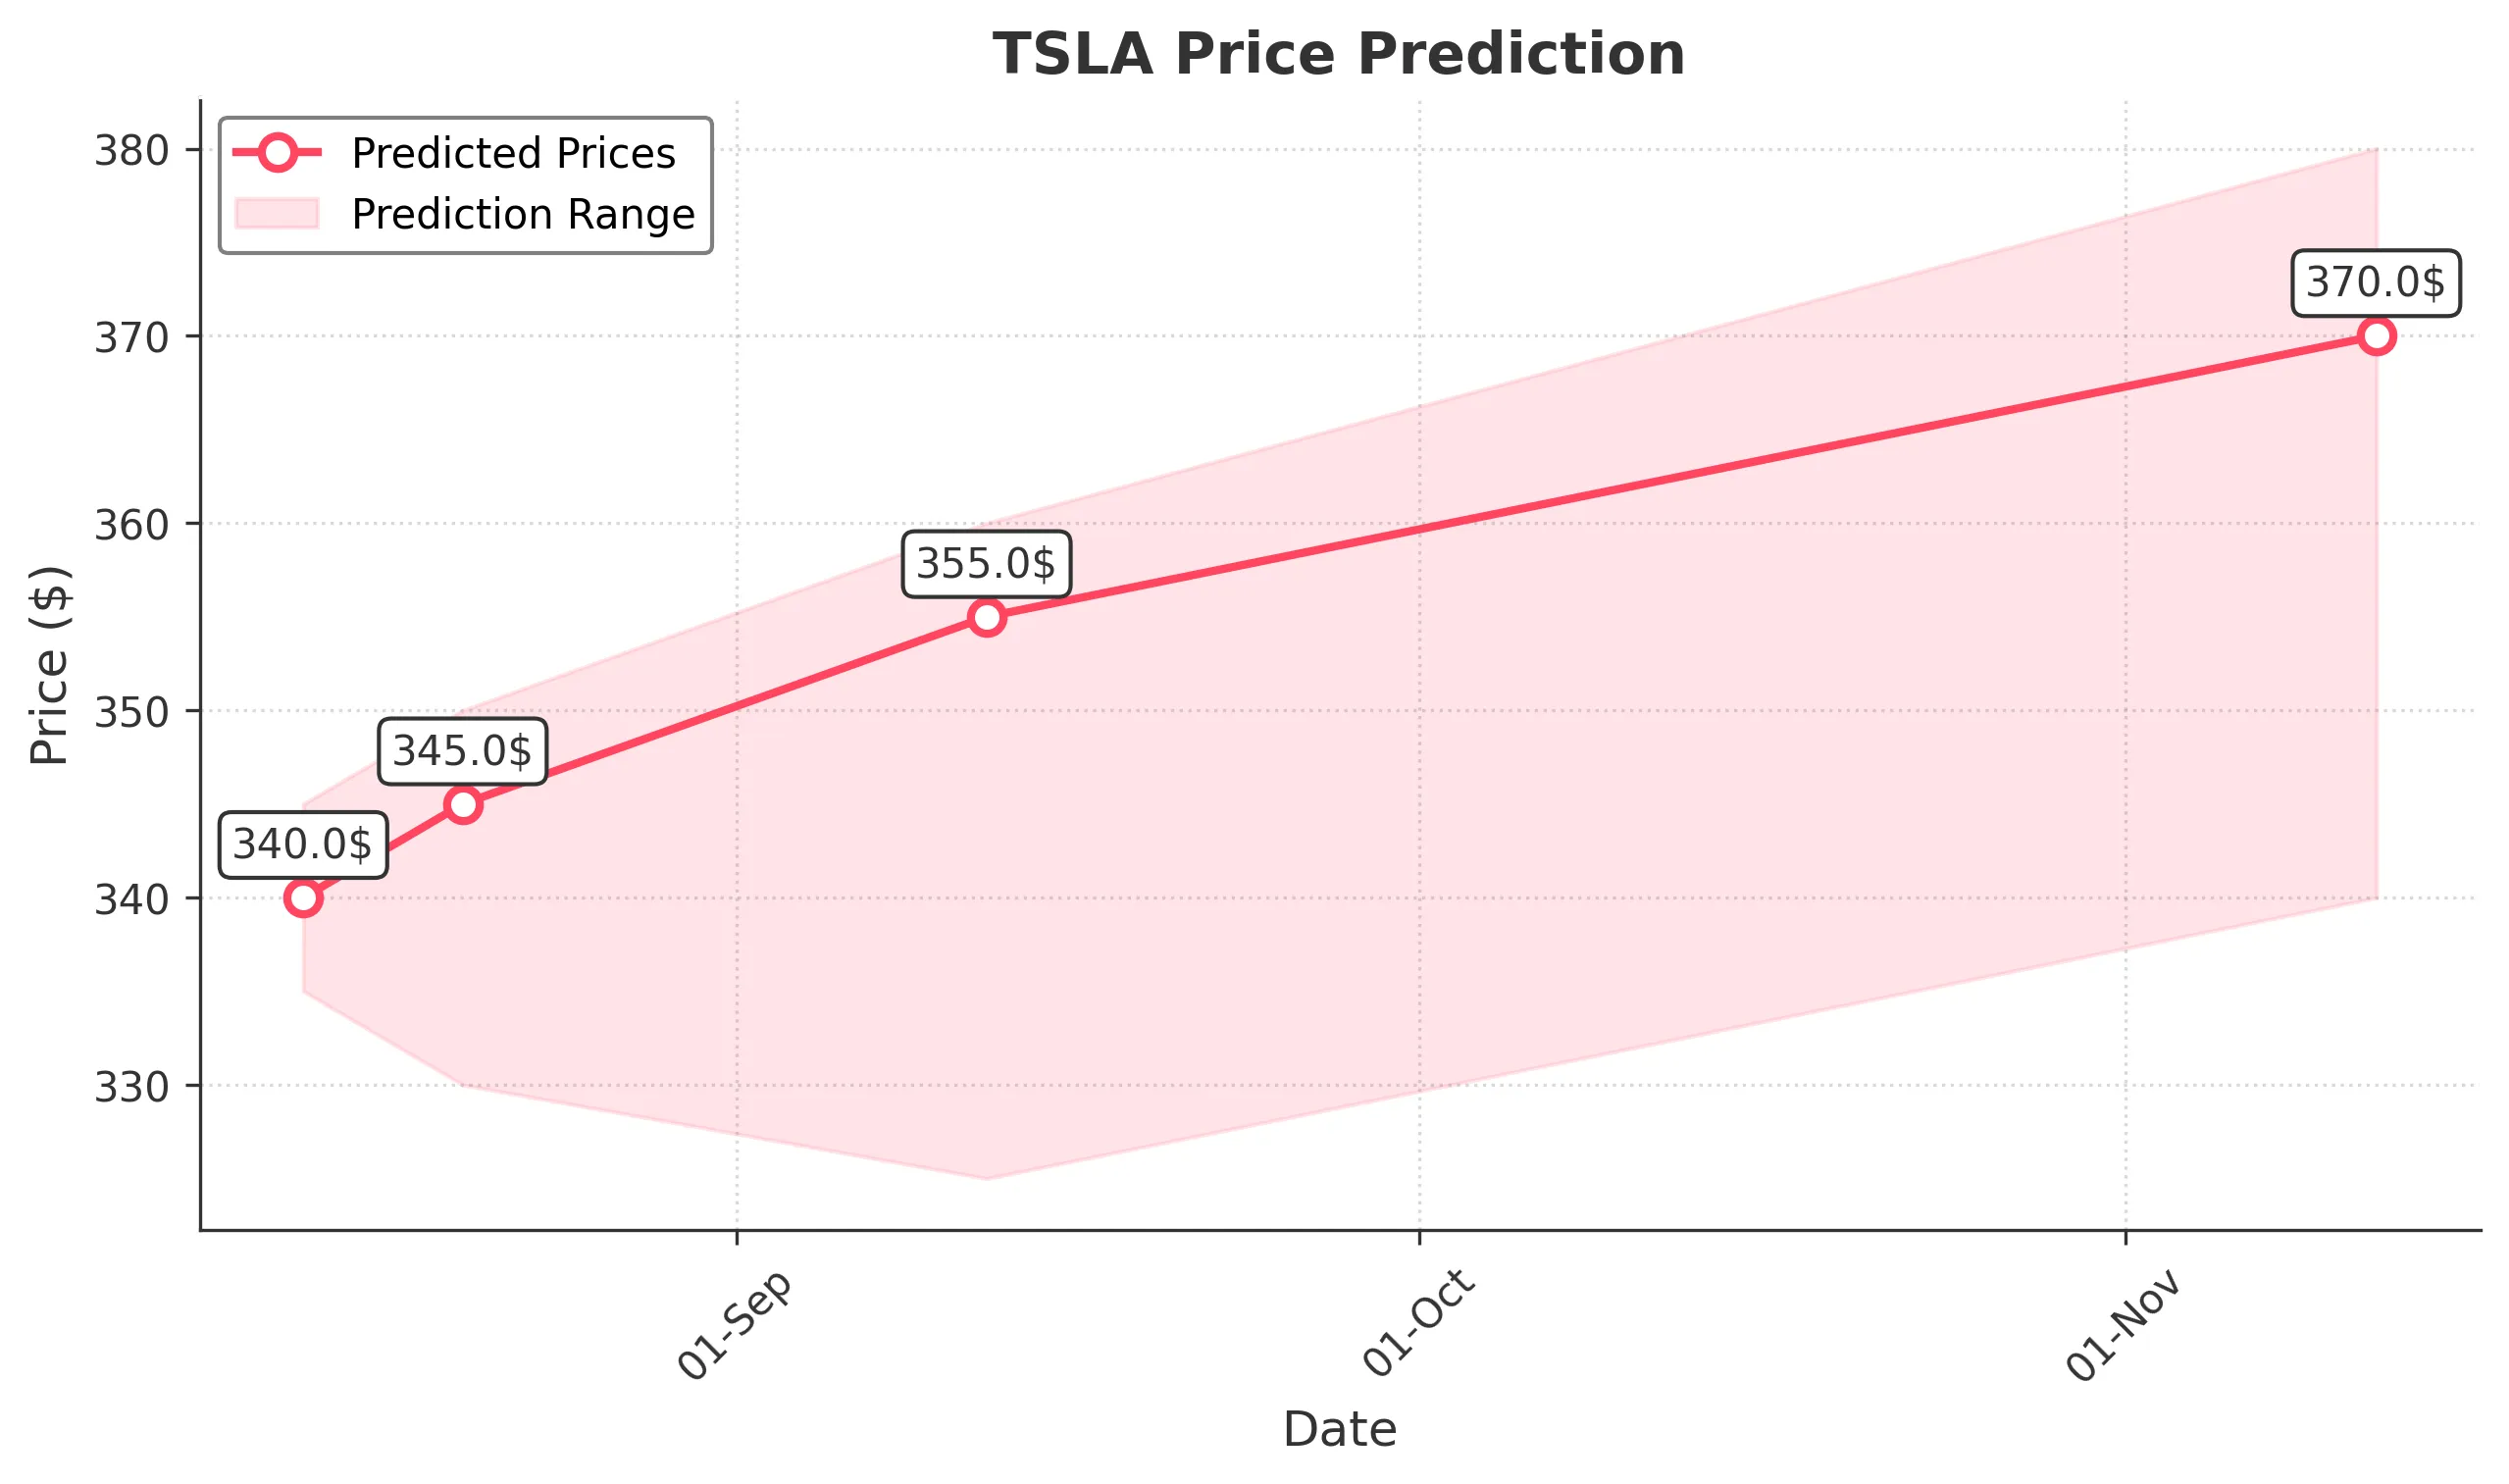
Target: August 13, 2025$340
$341
$345
$335
Description
The stock shows a bullish trend with a recent upward movement. RSI indicates overbought conditions, suggesting a potential pullback. However, strong support at 335.00 may hold. Volume is expected to remain high as traders react to recent price action.
Analysis
Over the past 3 months, TSLA has shown volatility with significant price swings. The recent bullish trend peaked, but the RSI indicates overbought conditions. Key support at 335.00 and resistance around 350.00. Volume spikes suggest active trading, but caution is warranted.
Confidence Level
Potential Risks
Potential for a reversal exists due to overbought RSI. Market sentiment may shift quickly.
1 Week Prediction
Target: August 20, 2025$345
$340
$350
$330
Description
Expect a slight upward trend as the stock consolidates. The MACD shows bullish momentum, but the RSI remains high, indicating potential resistance. Volume may increase as traders react to earnings reports or macroeconomic news.
Analysis
TSLA has been in a bullish phase, but recent volatility suggests caution. Key support at 330.00 and resistance at 350.00. The MACD indicates bullish momentum, but the high RSI raises concerns about sustainability. Volume patterns show increased trading activity.
Confidence Level
Potential Risks
High RSI could lead to a pullback. Market reactions to external news may impact price.
1 Month Prediction
Target: September 12, 2025$355
$350
$360
$325
Description
A bullish outlook as TSLA may break through resistance levels. The Fibonacci retracement suggests a target around 355.00. However, the high volatility and potential market corrections could lead to fluctuations.
Analysis
The stock has shown strong performance with key support at 325.00 and resistance at 360.00. The MACD and moving averages indicate bullish momentum, but the high volatility suggests caution. Volume spikes indicate active trading, reflecting investor interest.
Confidence Level
Potential Risks
Market sentiment and macroeconomic factors could lead to unexpected volatility.
3 Months Prediction
Target: November 12, 2025$370
$360
$380
$340
Description
Long-term bullish sentiment as TSLA may continue to rise, driven by strong fundamentals and market demand. However, potential economic downturns or regulatory changes could impact performance.
Analysis
TSLA has shown a strong upward trend, with key support at 340.00 and resistance at 380.00. The overall market sentiment is bullish, but external factors such as economic conditions and competition could pose risks. Volume trends indicate sustained interest.
Confidence Level
Potential Risks
Economic conditions and market sentiment could lead to volatility and price corrections.