TSLA Trading Predictions
1 Day Prediction
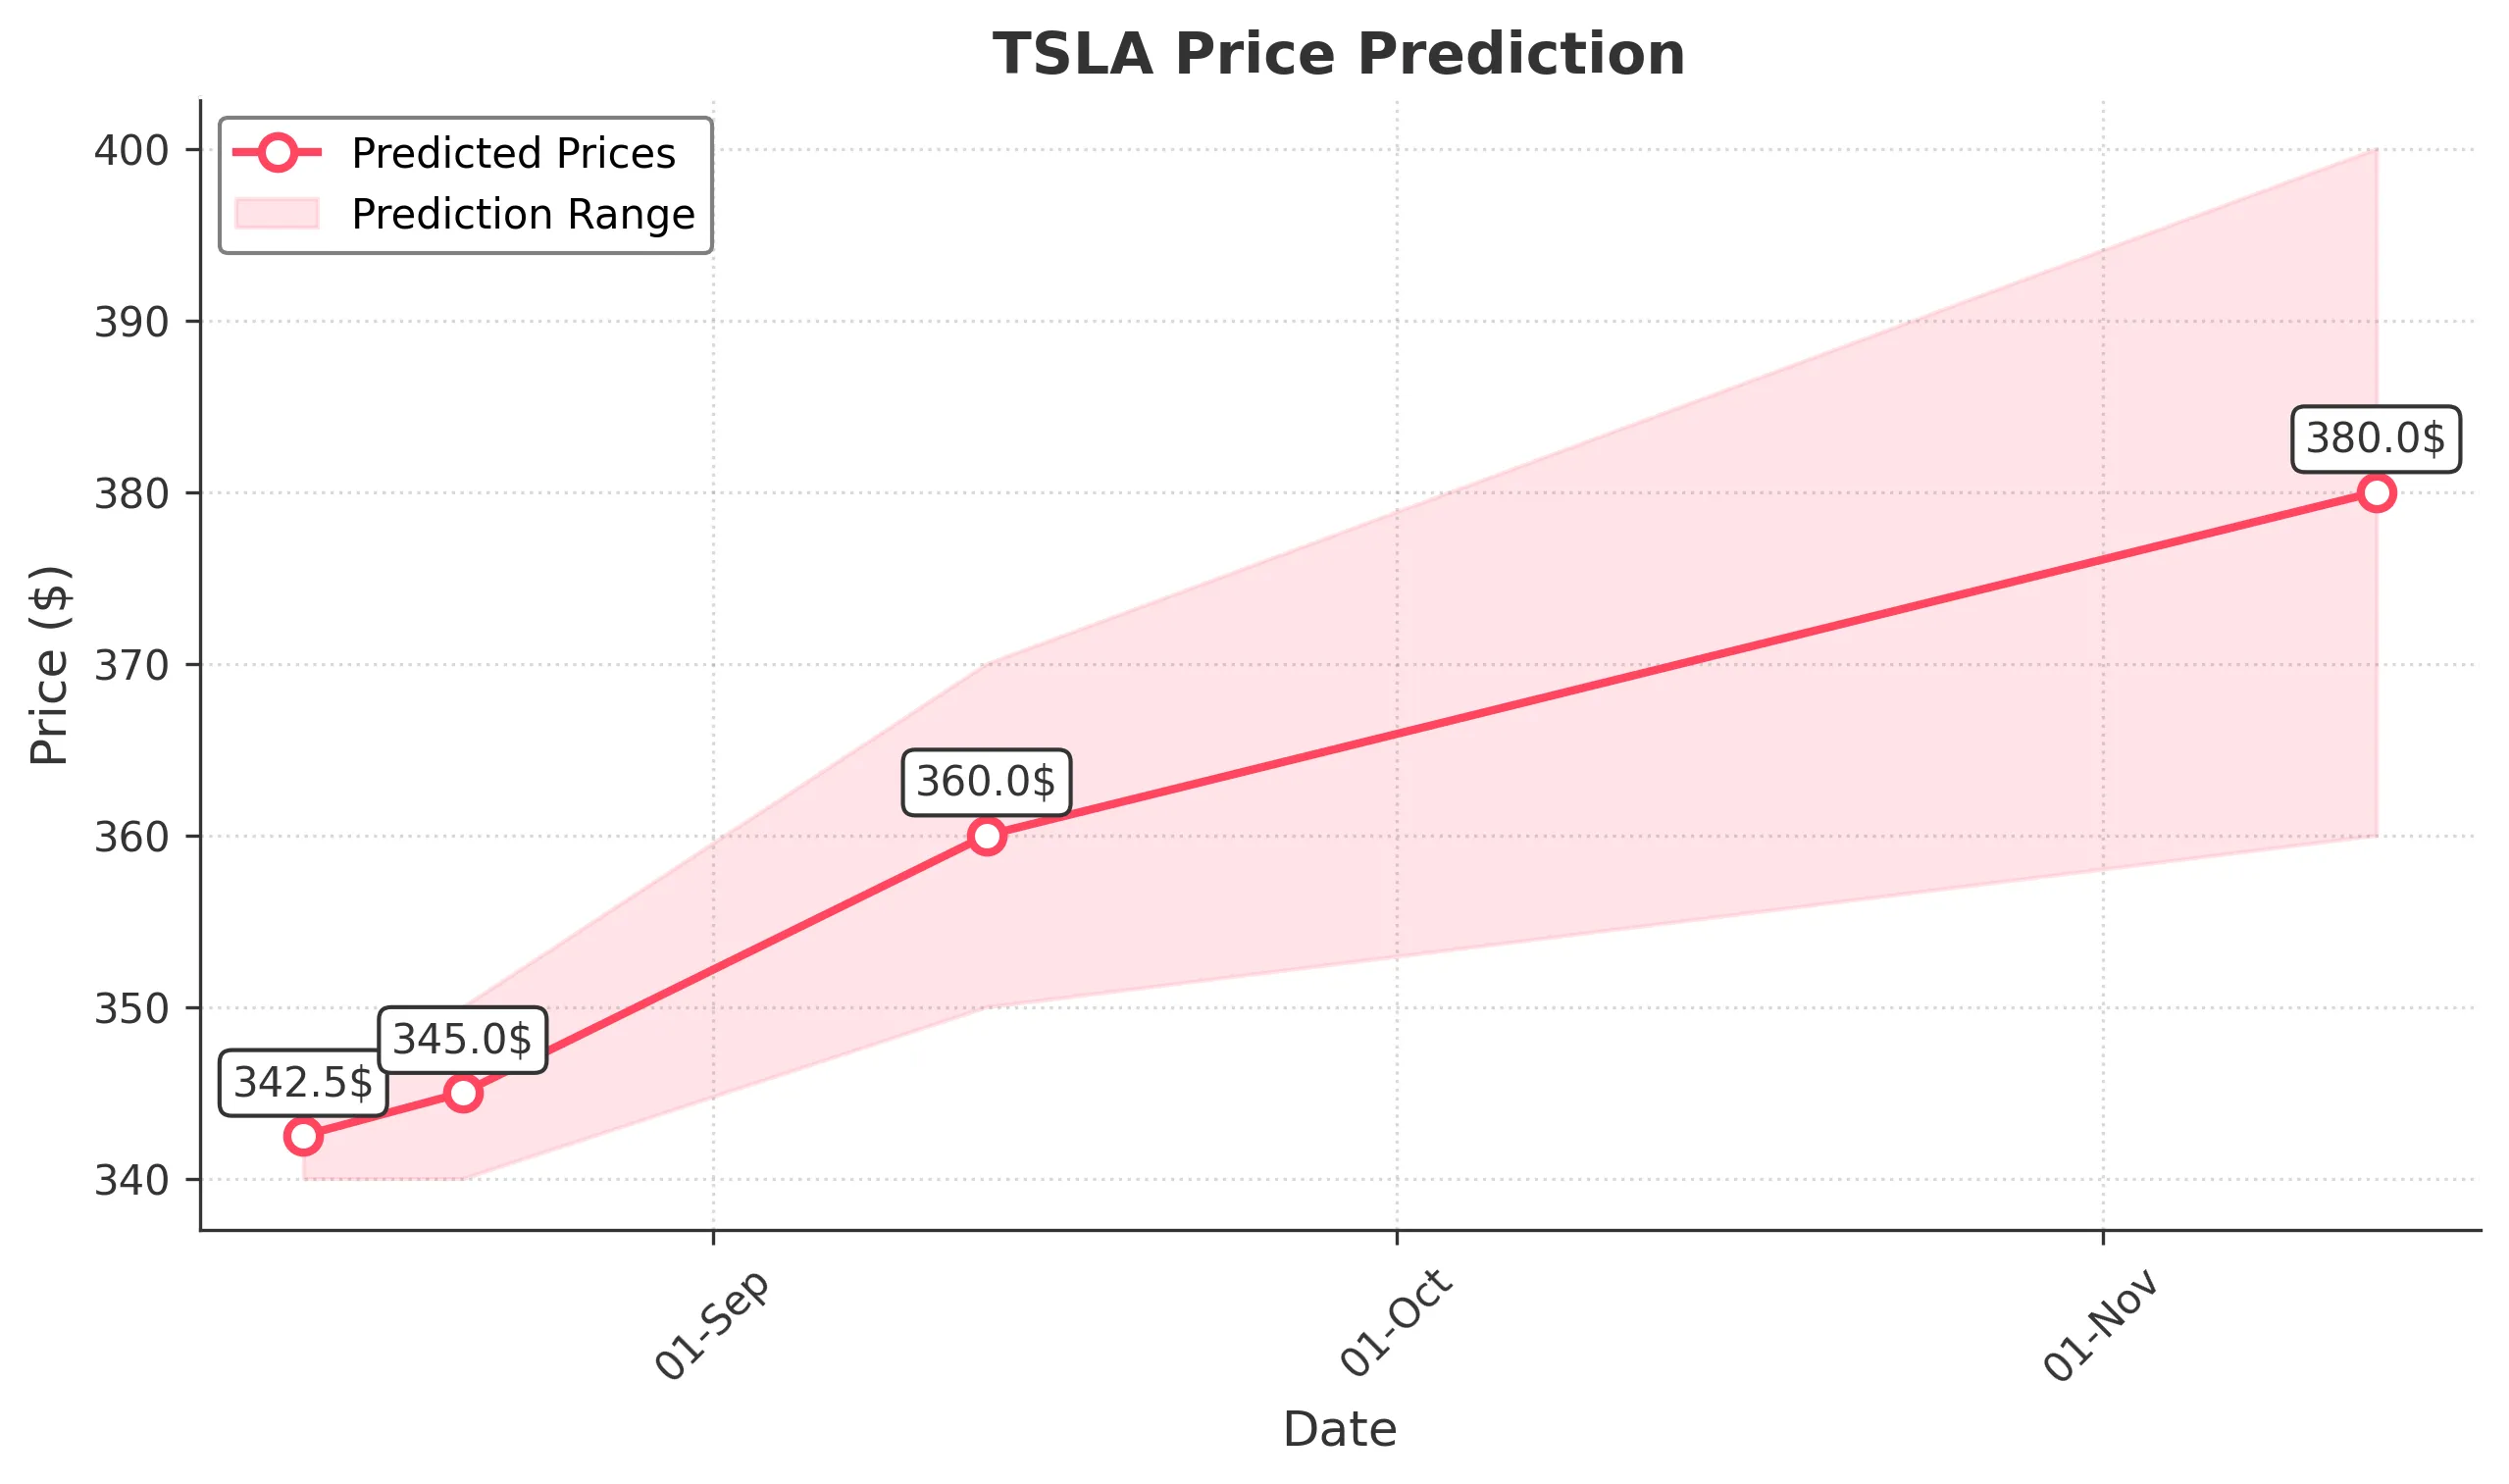
Target: August 14, 2025$342.5
$341
$345
$340
Description
The stock shows a slight bullish trend with a recent Doji candlestick indicating indecision. RSI is neutral, and MACD is close to crossing above the signal line, suggesting potential upward momentum. However, recent volatility may lead to fluctuations.
Analysis
Over the past 3 months, TSLA has experienced significant volatility, with a recent bearish phase followed by a recovery. Key support at $300 and resistance at $350. Moving averages indicate a potential bullish crossover, but the market remains sensitive to macroeconomic factors.
Confidence Level
Potential Risks
Market sentiment could shift due to external news or earnings reports, which may impact the stock's performance.
1 Week Prediction
Target: August 21, 2025$345
$342
$350
$340
Description
The stock is expected to continue its upward trend as bullish momentum builds. The MACD is showing signs of a bullish crossover, and the RSI is approaching overbought territory, indicating strong buying interest. However, watch for potential pullbacks.
Analysis
TSLA has shown a recovery from recent lows, with strong buying volume. The stock is currently testing resistance levels around $350. Technical indicators suggest a bullish outlook, but external factors could introduce volatility.
Confidence Level
Potential Risks
If market sentiment shifts negatively or if there are unexpected earnings results, the stock could face downward pressure.
1 Month Prediction
Target: September 13, 2025$360
$355
$370
$350
Description
With the current bullish trend and positive market sentiment, TSLA is likely to reach higher levels. The Fibonacci retracement levels suggest a target around $360, supported by strong buying volume. However, overbought conditions may lead to corrections.
Analysis
The stock has shown resilience with a bullish trend, supported by strong volume and positive technical indicators. Key resistance at $370 may pose challenges, while support remains at $340. Market sentiment is cautiously optimistic.
Confidence Level
Potential Risks
Potential market corrections or negative news could impact the stock's upward trajectory, leading to increased volatility.
3 Months Prediction
Target: November 13, 2025$380
$375
$400
$360
Description
If the current bullish momentum continues, TSLA could reach $380 in three months. The MACD and RSI indicate strong upward momentum, but potential resistance at $400 may limit gains. Market conditions and macroeconomic factors will be crucial.
Analysis
TSLA has shown a strong recovery and upward trend over the past months. Key support at $350 and resistance at $400 are critical levels to watch. Technical indicators suggest bullish momentum, but external factors could introduce volatility.
Confidence Level
Potential Risks
Long-term predictions are subject to greater uncertainty due to potential market shifts, economic changes, or company-specific news that could impact investor sentiment.