TSLA Trading Predictions
1 Day Prediction
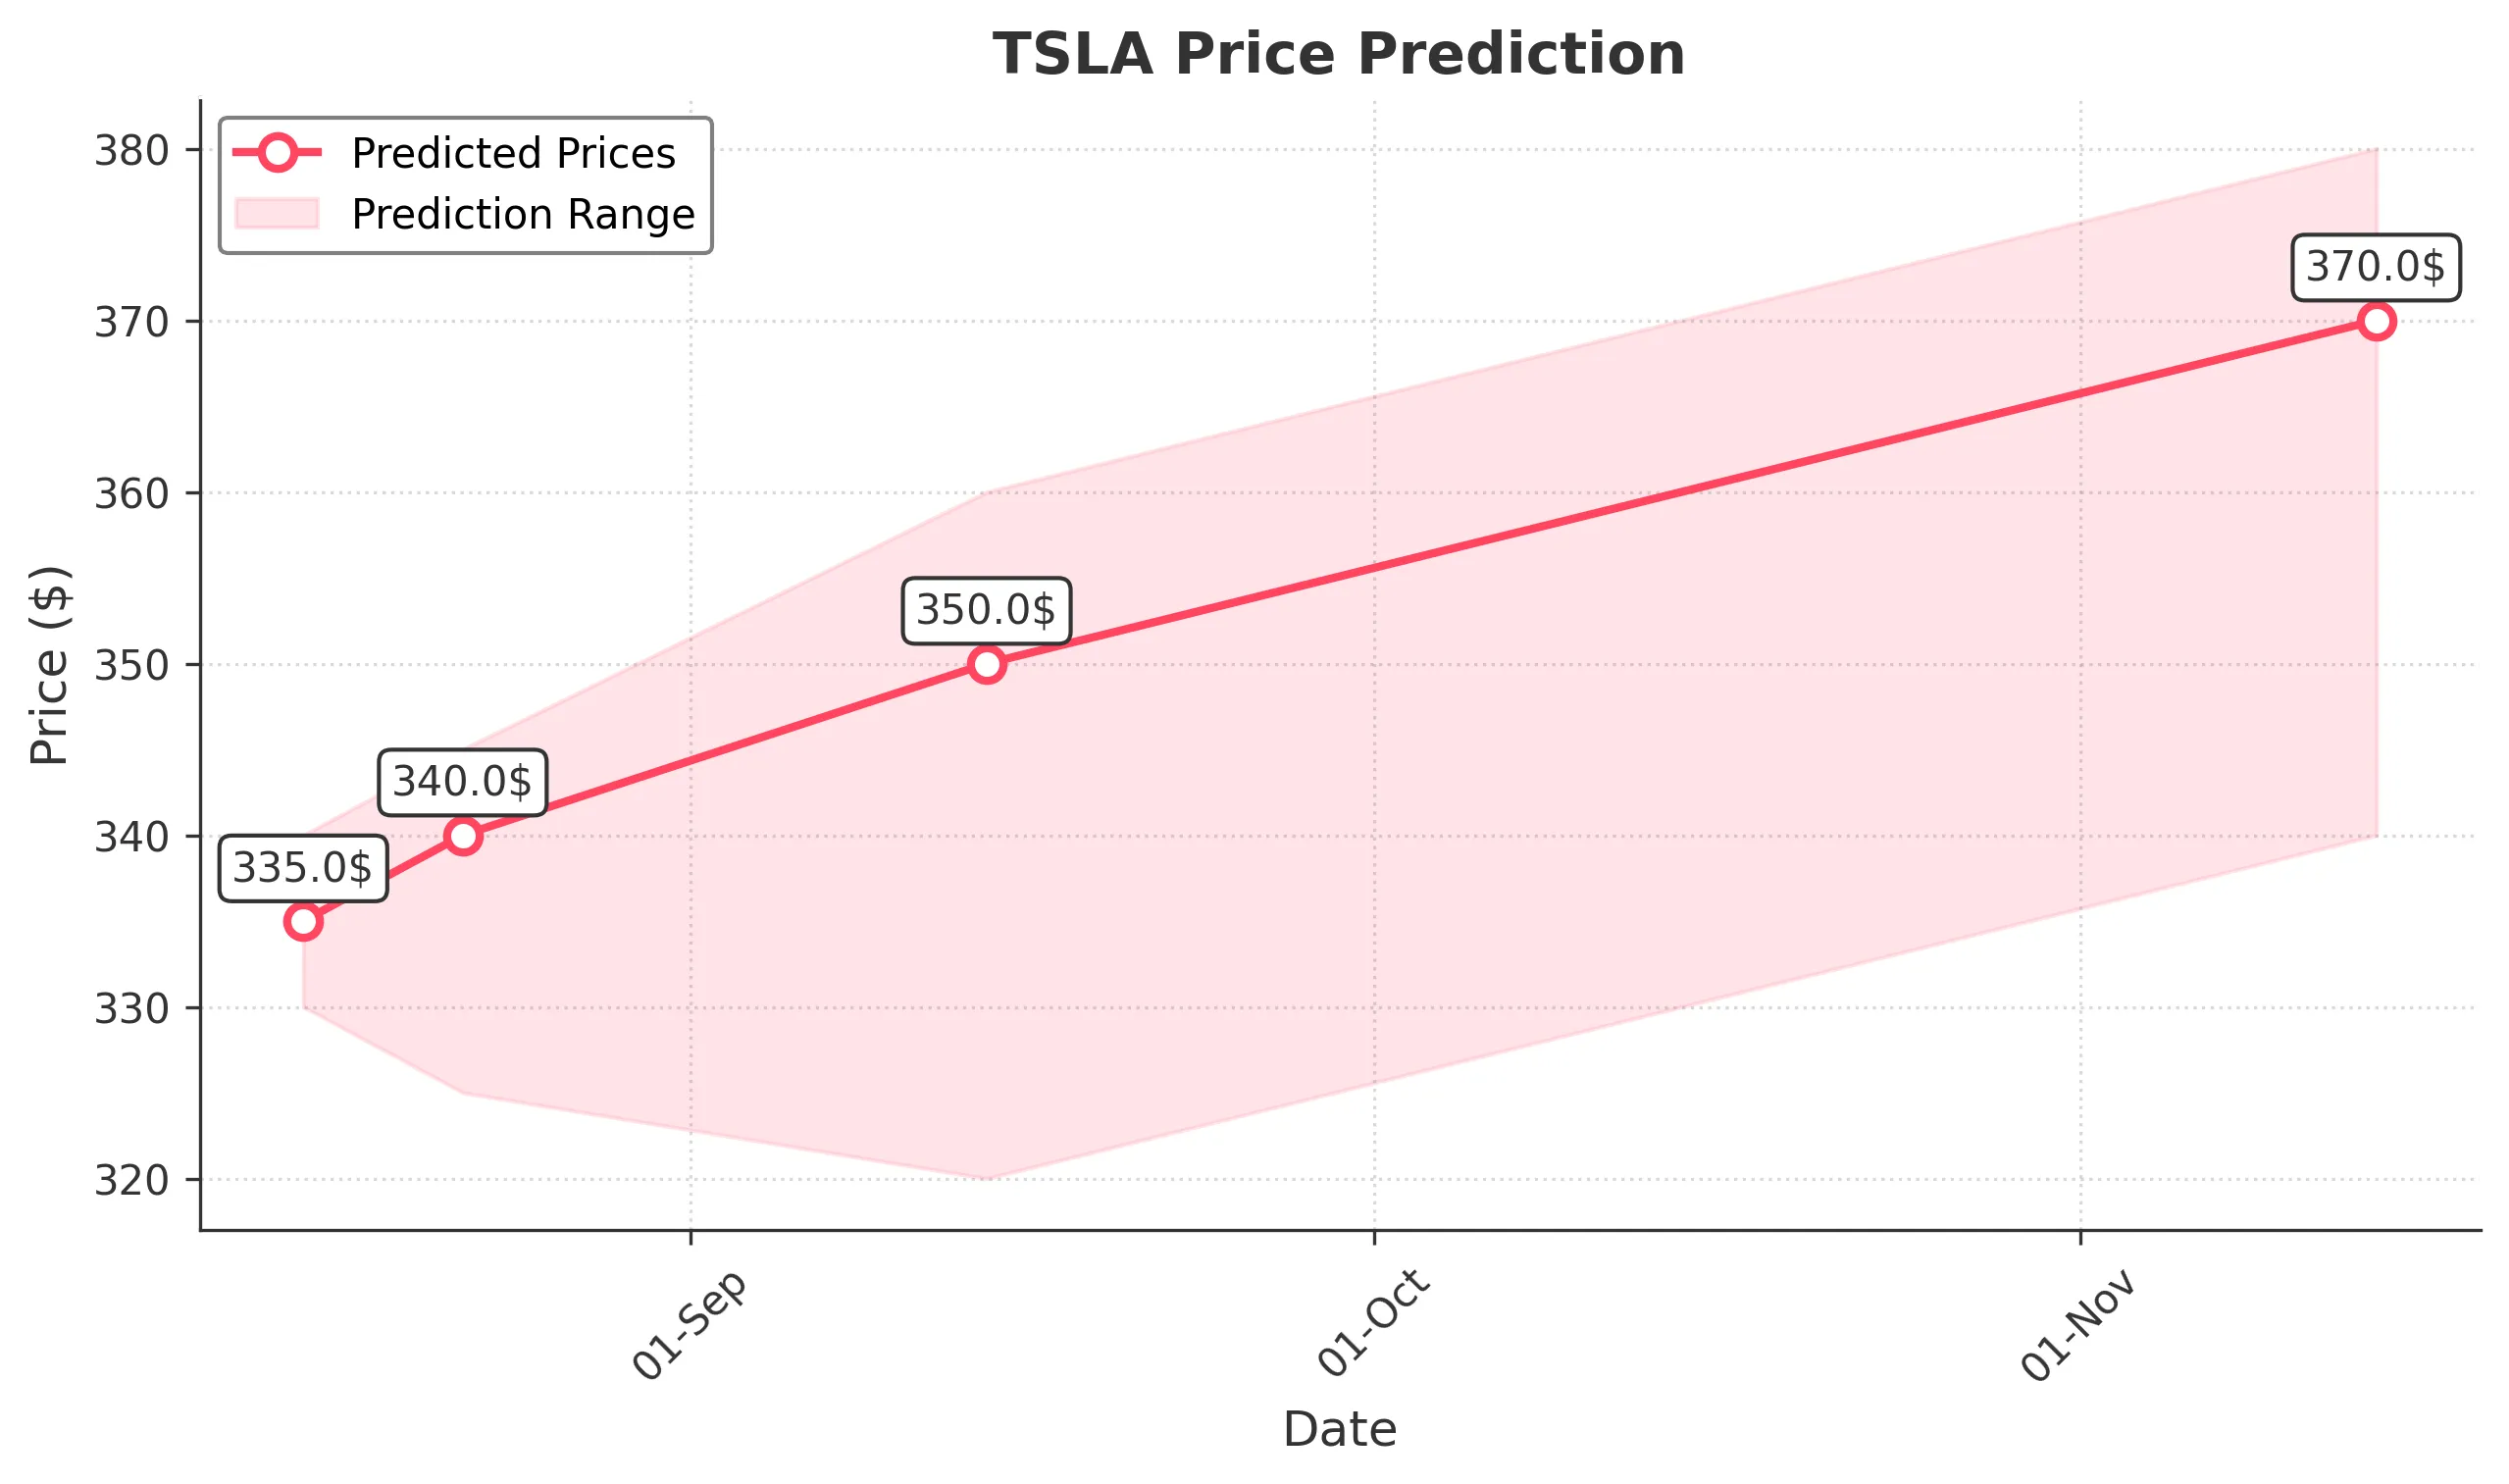
Target: August 15, 2025$335
$334
$340
$330
Description
The stock shows a slight bullish trend with a recent Doji pattern indicating indecision. RSI is neutral, and MACD is close to crossing above the signal line. Expecting a minor rebound after recent declines.
Analysis
TSLA has shown volatility with recent highs and lows. The stock is currently in a sideways trend with support around 330 and resistance near 340. Volume has been decreasing, indicating potential consolidation.
Confidence Level
Potential Risks
Market sentiment could shift due to external news or earnings reports, which may impact the prediction.
1 Week Prediction
Target: August 22, 2025$340
$335
$345
$325
Description
Expecting a gradual recovery as the stock approaches key Fibonacci retracement levels. The MACD shows potential bullish momentum, but RSI indicates overbought conditions.
Analysis
The stock has been fluctuating with a bearish bias recently. Key support at 325 and resistance at 345. Volume spikes on down days suggest selling pressure, while recent candlestick patterns indicate indecision.
Confidence Level
Potential Risks
Potential for a pullback if market sentiment shifts negatively or if earnings disappoint.
1 Month Prediction
Target: September 14, 2025$350
$340
$360
$320
Description
Anticipating a bullish trend as the stock breaks above resistance levels. Positive market sentiment and potential new product announcements could drive prices higher.
Analysis
TSLA has shown resilience with a recent upward trend. Key support at 320 and resistance at 360. The stock's volatility is high, and recent volume patterns suggest accumulation, indicating bullish sentiment.
Confidence Level
Potential Risks
Market volatility and macroeconomic factors could impact the stock's performance.
3 Months Prediction
Target: November 14, 2025$370
$360
$380
$340
Description
Expecting continued growth driven by strong earnings and market expansion. Technical indicators suggest a bullish trend, but overbought conditions may lead to corrections.
Analysis
The stock has been on a bullish trend with significant support at 340 and resistance at 380. Recent volume trends indicate strong buying interest, but potential market corrections should be monitored closely.
Confidence Level
Potential Risks
Unforeseen market events or economic downturns could negatively impact the stock's trajectory.