USDJPYX Trading Predictions
1 Day Prediction
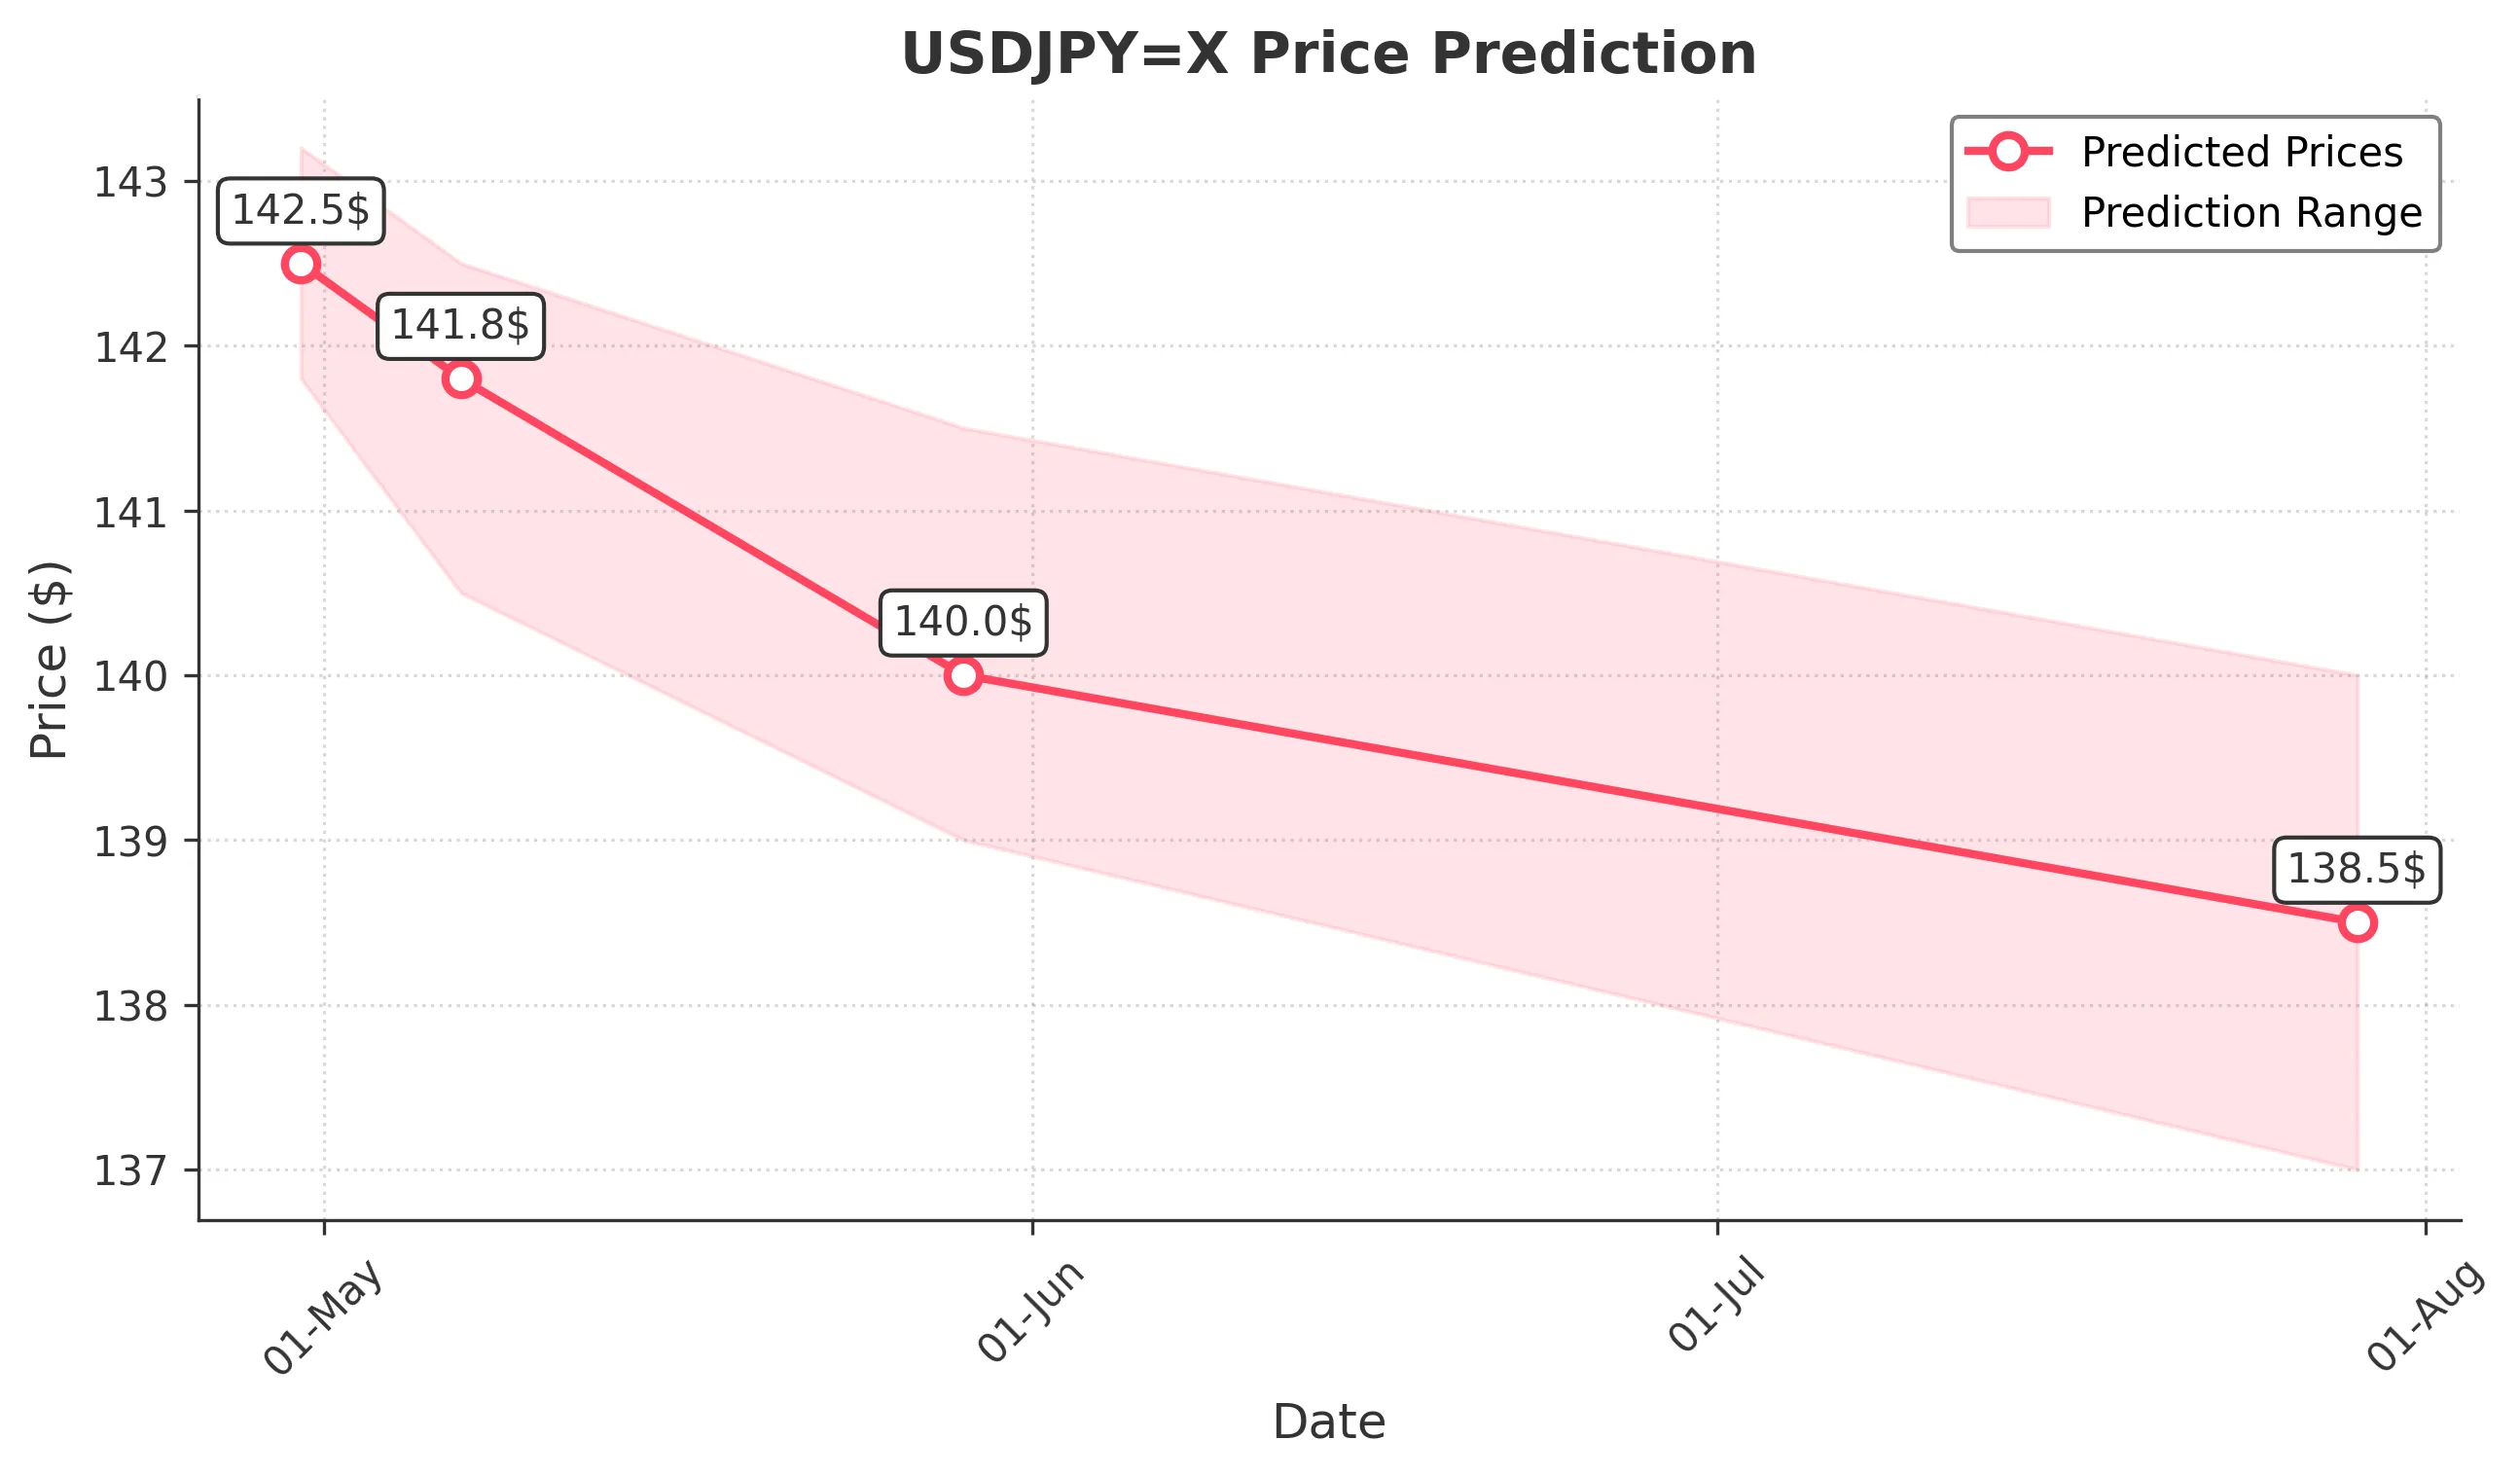
Target: April 30, 2025$142.5
$142.2
$143.2
$141.8
Description
The recent bearish trend indicates a potential continuation. The RSI is approaching oversold levels, suggesting a possible short-term rebound. However, MACD shows a bearish crossover, indicating downward momentum. Volatility remains high, warranting caution.
Analysis
Over the past 3 months, USDJPY has shown a bearish trend, with significant support around 140.87 and resistance near 144.02. The moving averages indicate a downward trajectory, while volume has been low, suggesting lack of conviction. Recent candlestick patterns show indecision, indicating potential volatility.
Confidence Level
Potential Risks
Market sentiment could shift due to macroeconomic news or geopolitical events, which may impact the prediction.
1 Week Prediction
Target: May 7, 2025$141.8
$142
$142.5
$140.5
Description
The bearish trend is expected to persist, with potential for a slight recovery. The Bollinger Bands indicate a squeeze, suggesting upcoming volatility. The MACD remains bearish, and the RSI is nearing oversold territory, indicating a possible bounce.
Analysis
The stock has been in a bearish phase, with key support at 140.87. The moving averages are trending downwards, and the ATR indicates increasing volatility. Recent candlestick patterns show bearish engulfing formations, reinforcing the downward sentiment.
Confidence Level
Potential Risks
Unforeseen economic data releases or geopolitical tensions could lead to sudden price movements, affecting the accuracy of this prediction.
1 Month Prediction
Target: May 29, 2025$140
$141
$141.5
$139
Description
Continued bearish pressure is anticipated, with potential for further declines. The Fibonacci retracement levels suggest 140 as a critical support zone. The MACD remains in a bearish phase, and the RSI indicates oversold conditions, which may lead to a short-term bounce.
Analysis
The overall trend has been bearish, with significant resistance at 144.02 and support at 140.87. The moving averages indicate a downward trend, and volume patterns suggest a lack of buying interest. Recent candlestick patterns show bearish signals, indicating potential for further declines.
Confidence Level
Potential Risks
Market volatility and external economic factors could lead to unexpected price movements, impacting the prediction's reliability.
3 Months Prediction
Target: July 29, 2025$138.5
$139
$140
$137
Description
A bearish outlook is expected to continue, with potential for further declines as economic conditions evolve. The MACD remains bearish, and the RSI indicates oversold conditions, suggesting a possible bounce but overall downward pressure.
Analysis
The stock has been in a bearish trend, with key support at 140.87. The moving averages indicate a downward trajectory, and the ATR suggests increasing volatility. Recent candlestick patterns show bearish signals, indicating potential for further declines.
Confidence Level
Potential Risks
Economic indicators and geopolitical events could significantly alter market sentiment, leading to unexpected price movements.