USDJPYX Trading Predictions
1 Day Prediction
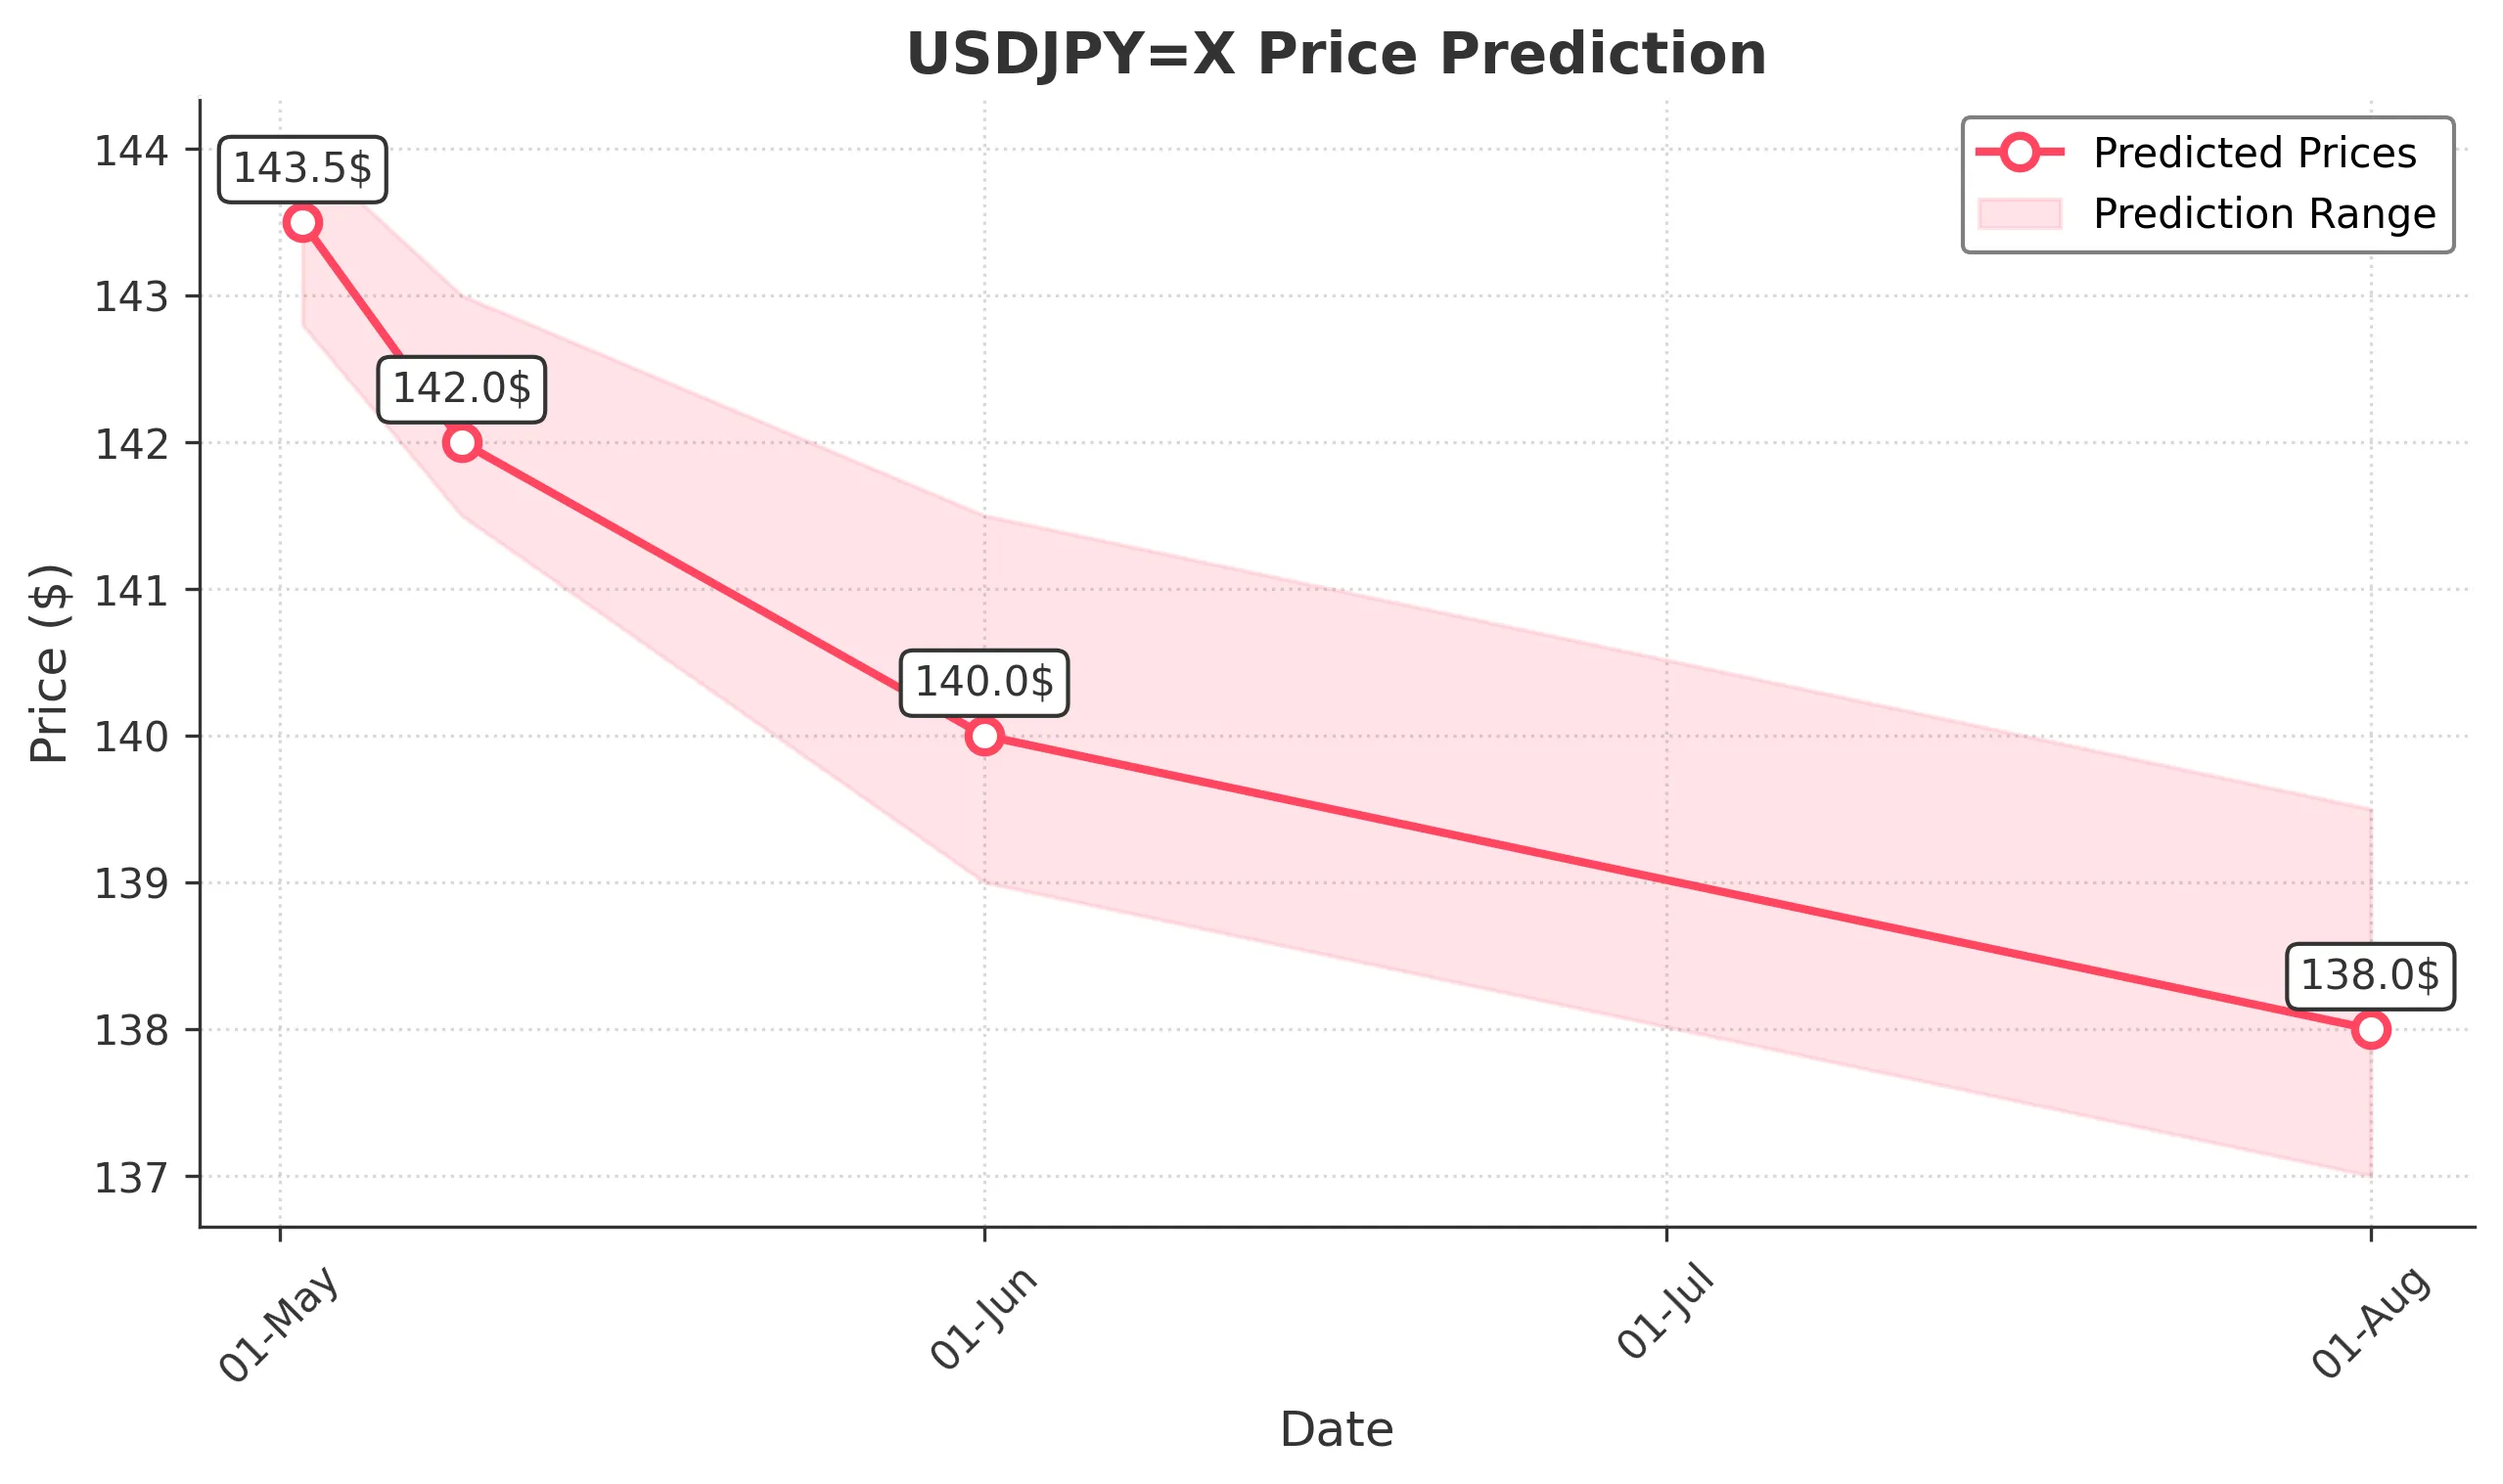
Target: May 2, 2025$143.5
$143
$144
$142.8
Description
The recent bearish trend indicates a potential continuation, with the RSI showing oversold conditions. A slight rebound is expected, but resistance at 144.0 may limit gains. Volume remains low, suggesting weak buying interest.
Analysis
Over the past 3 months, USDJPY has shown a bearish trend, with significant support around 142.0 and resistance near 144.0. The MACD indicates a bearish crossover, while the ATR suggests increasing volatility. Volume patterns are low, indicating a lack of strong conviction in price movements.
Confidence Level
Potential Risks
Market volatility and external economic news could impact the prediction. A sudden shift in sentiment may lead to unexpected price movements.
1 Week Prediction
Target: May 9, 2025$142
$143
$143
$141.5
Description
The bearish momentum is likely to persist, with the price testing support at 142.0. The RSI remains low, indicating potential for further declines. A lack of bullish signals suggests continued selling pressure.
Analysis
The stock has been in a downtrend, with key support at 142.0. Technical indicators like the Bollinger Bands suggest a tight range, while the MACD remains bearish. Volume analysis shows low activity, indicating a lack of strong buying interest.
Confidence Level
Potential Risks
Unforeseen macroeconomic events or changes in market sentiment could lead to a reversal. The potential for a short squeeze exists if buying interest suddenly increases.
1 Month Prediction
Target: June 1, 2025$140
$141
$141.5
$139
Description
Continued bearish sentiment is expected, with the price likely to test lower support levels. The MACD and RSI indicate persistent selling pressure, and the market may react negatively to upcoming economic data.
Analysis
The overall trend has been bearish, with significant resistance at 144.0 and support at 140.0. The ATR indicates increasing volatility, and the lack of strong volume suggests uncertainty in market direction. Candlestick patterns show a series of lower highs.
Confidence Level
Potential Risks
Economic indicators and geopolitical events could significantly alter market dynamics. A sudden bullish reversal is possible if sentiment shifts.
3 Months Prediction
Target: August 1, 2025$138
$139
$139.5
$137
Description
The bearish trend is expected to continue, with potential for further declines as economic conditions may worsen. The RSI indicates oversold conditions, but without strong buying signals, further downside is likely.
Analysis
The stock has been in a consistent downtrend, with key support at 138.0. Technical indicators suggest a lack of bullish momentum, and the MACD remains bearish. Volume patterns indicate low participation, which may lead to increased volatility.
Confidence Level
Potential Risks
Market sentiment can change rapidly due to economic data releases or geopolitical events, which may lead to unexpected price movements.